

Your test suite went green. The deploy went out. Three days later, a support ticket lands: the AI assistant is confidently telling users the wrong cancellation policy. Your Grafana dashboard shows nothing. Latency is fine. Error rate is zero. The service is "healthy."
That is what an LLM quality regression looks like. No stack trace. No 500 error. Just a large language model producing subtly wrong outputs two deploys ago, and a monitoring stack with no way to see it.
AI observability for QA teams closes this gap, giving you the telemetry and pipeline integrations to catch output quality regressions in production AI workflows before your users do. This post covers what to instrument, which tools to use, how to wire it into your CI/CD pipeline, and where classical approaches break down entirely.
Why Classical Monitoring Fails for LLM-Powered Features
A team we worked with last quarter had full Prometheus and Grafana coverage, p95 latency well within SLA, and a 500-test suite that passed consistently. They upgraded their model from GPT-3.5 to GPT-4o-mini, ran all their tests, got green across the board, and shipped. Two weeks later, their onboarding chatbot was giving contradictory guidance on paid vs free tier features. The regression had been live the entire time. No alert fired. No dashboard turned red. The only signal was a customer complaint.
Classical monitoring tells you a service is up. It cannot tell you the service is saying the right things.
Three properties make LLM outputs ungovernable by traditional test assertions. First, non-determinism: the same input produces different outputs across runs, making exact-match assertions structurally useless. Second, context-sensitivity: output quality shifts based on real user input distributions and session state that your test harness does not replicate. Third, emergent failure modes: the model does not crash, it hallucinates, drifts, or shifts tone in ways that look correct to infrastructure monitors and wrong to actual users.
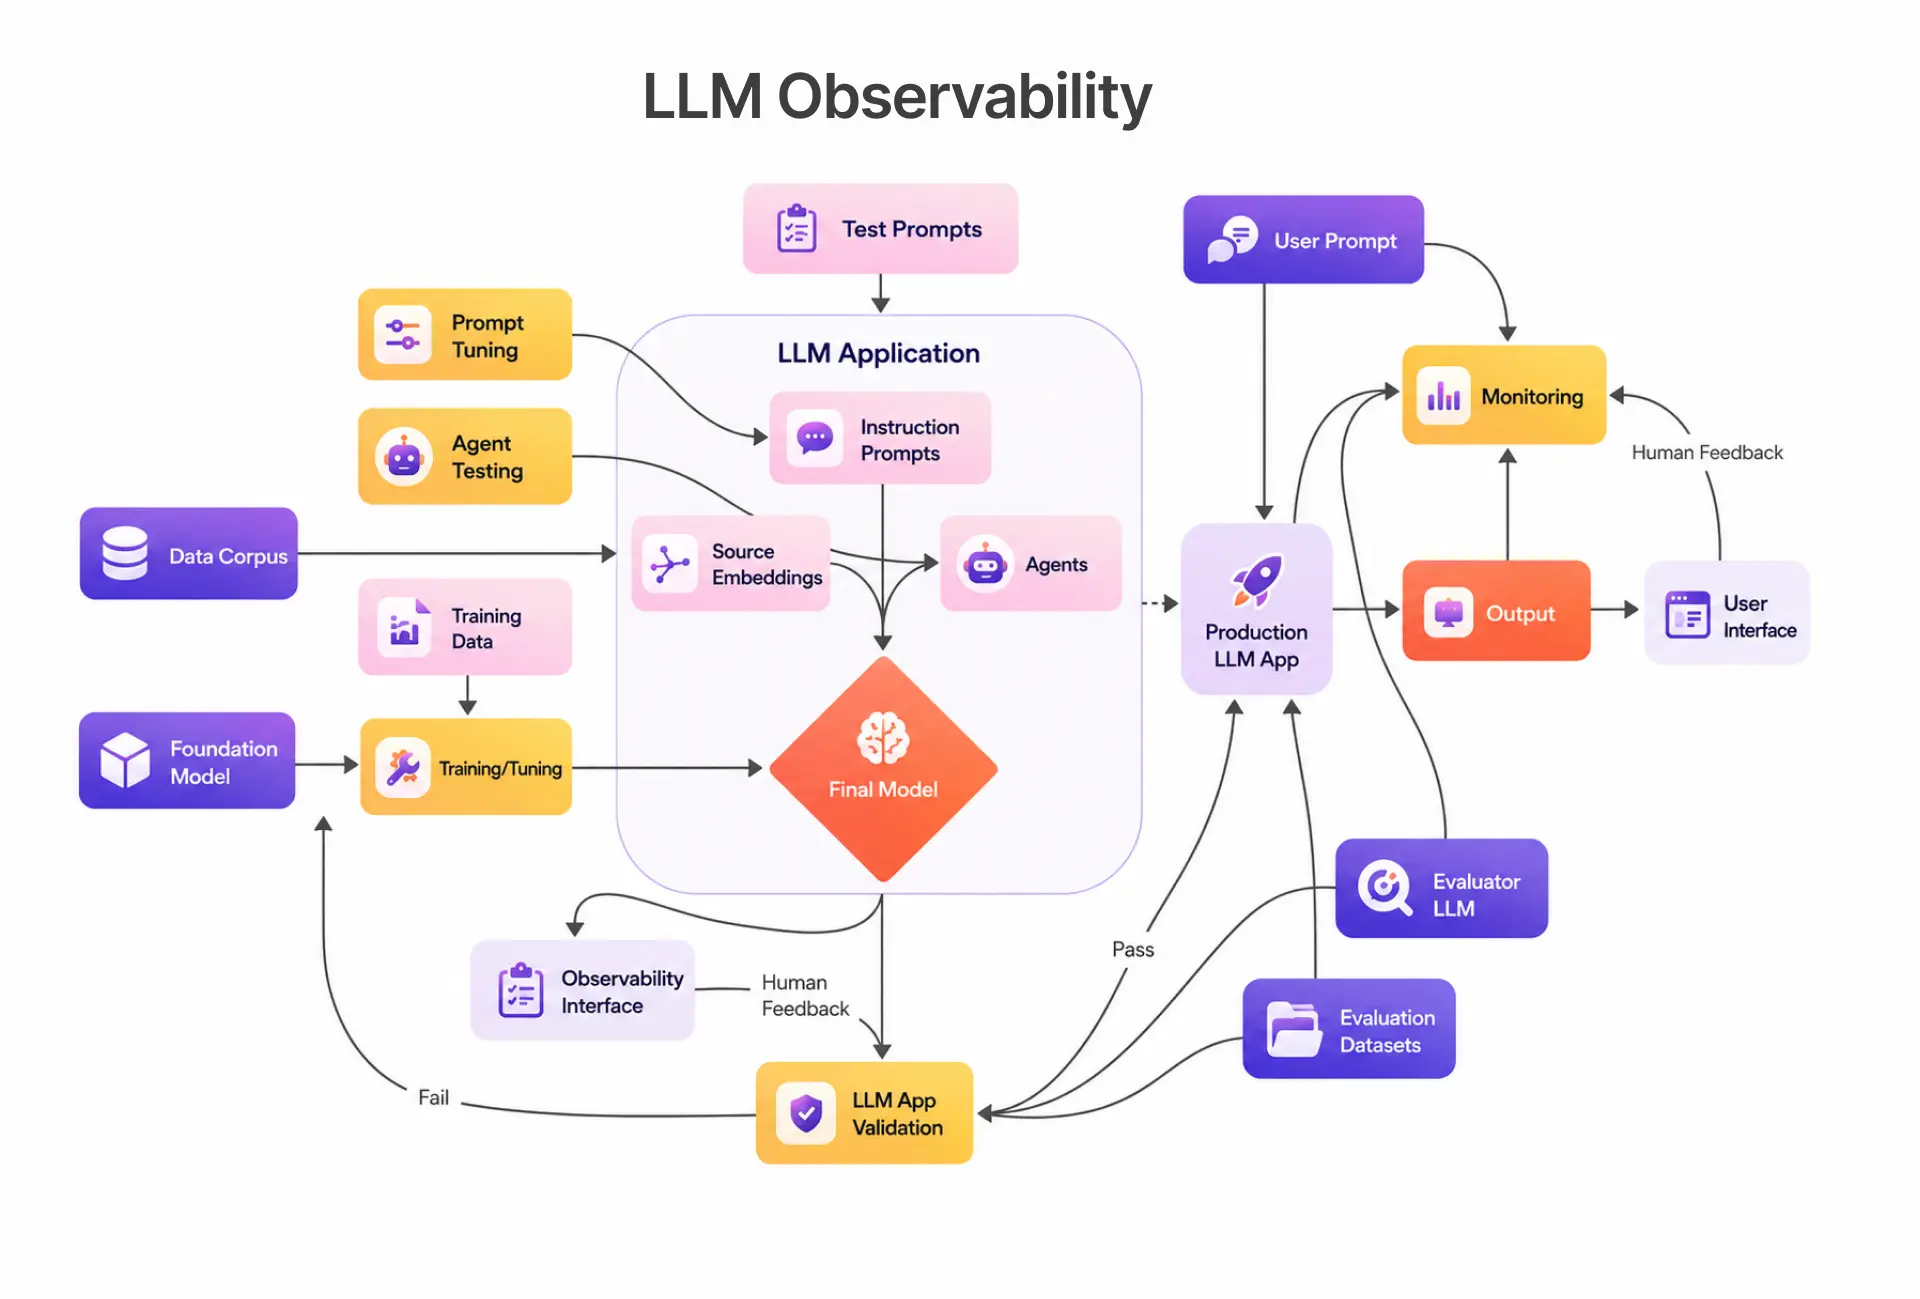
Traditional ML models behaved predictably given fixed inputs. Generative AI does not. Prometheus can alert when a metric crosses a threshold. It cannot store LLM outputs, compare them semantically to reference responses, or tell you whether a prompt file change three deploys ago caused the issue.
The Non-Determinism Problem in LLM QA
Temperature settings and model-internal stochasticity mean you cannot run the same prompt twice and expect identical output. The practical implication: assertEqual(expected, actual) does not work on LLM outputs. You need semantic similarity scoring against a reference output, statistical distribution analysis across multiple runs, and format compliance checks that tolerate surface variation while catching substantive changes in accuracy or tone.
Regression suites built on exact-match logic are particularly exposed here. What passed last sprint may silently fail this sprint with no visible signal.
How Prompt Drift Breaks Production Silently
Prompt drift is what happens when small incremental changes to system prompts, model versions, or retrieval quality accumulate into measurable output degradation over time. No single change breaks anything. The regression builds across deploys.
The pattern we see most often: a prompt file is tightened in sprint four, a model version bumps in sprint seven, and a retrieval chunk size changes in sprint nine. Each change passes unit tests. By sprint ten, output tone has shifted, accuracy has dropped on edge-case queries, and relevance gaps have opened up in responses that downstream systems parse. Nothing in Grafana flagged any of it.
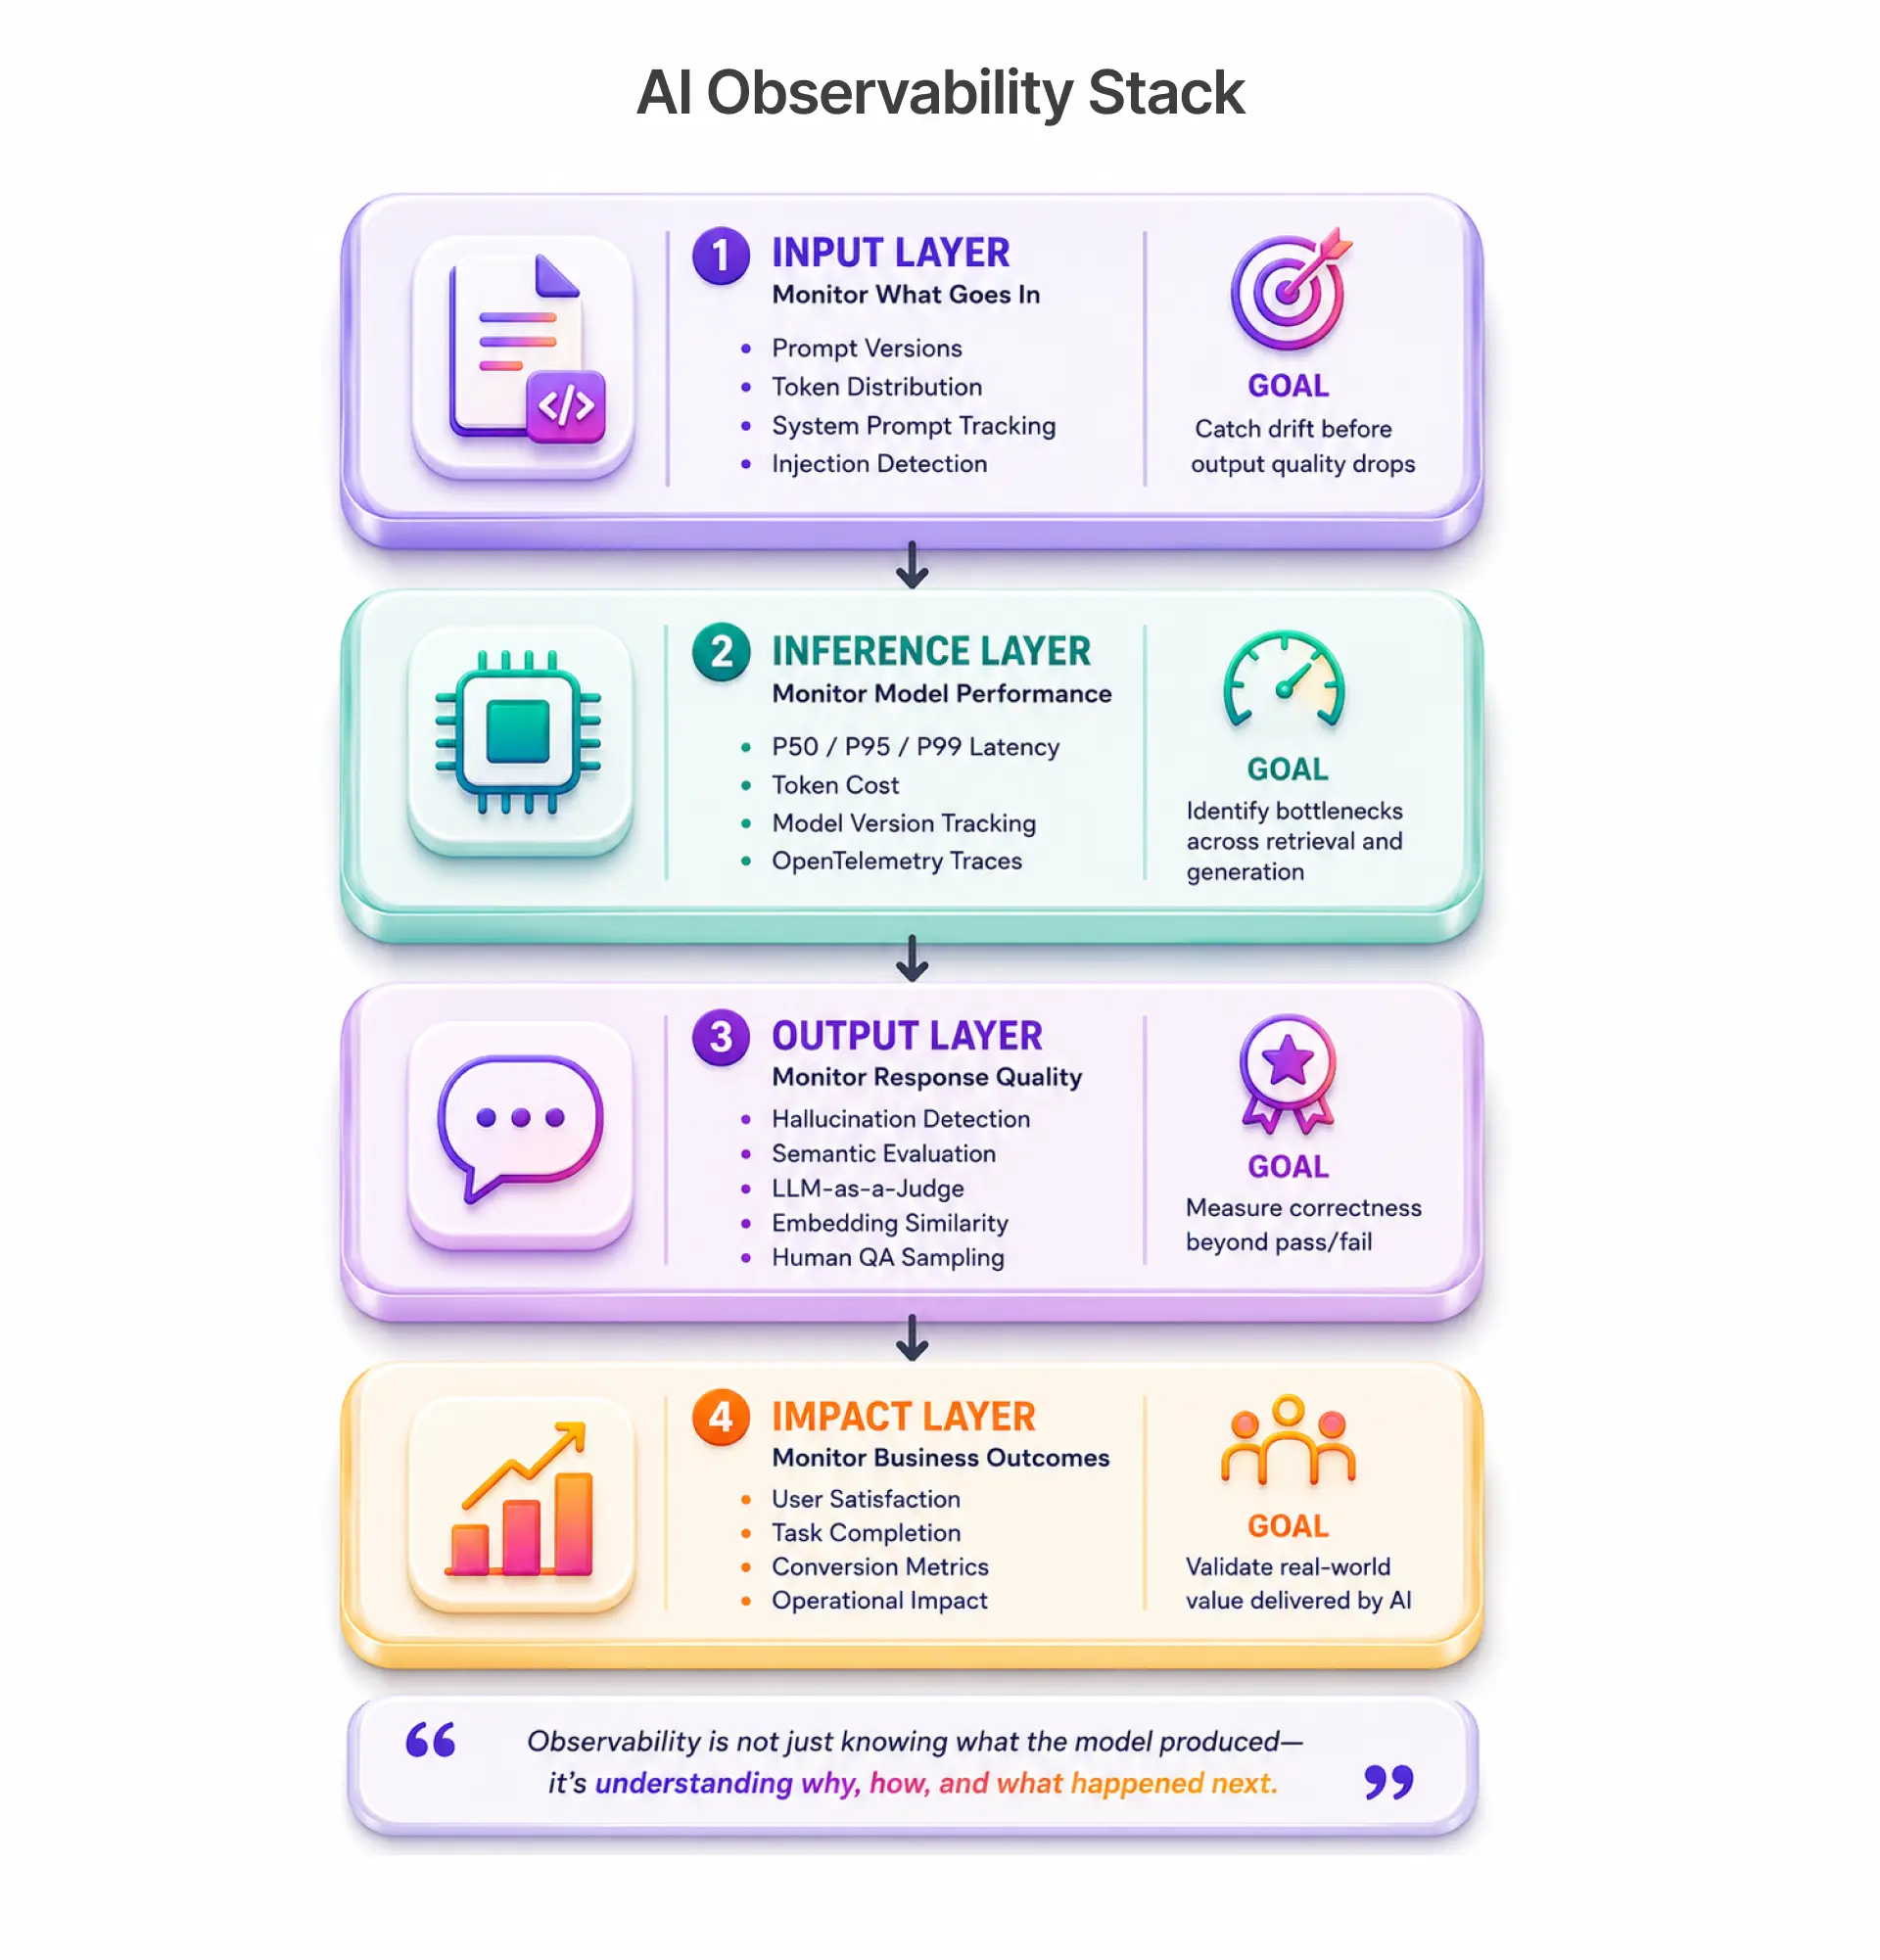
The Four-Layer AI Observability Stack
Think of LLM observability in four layers. Each surfaces different failure signals, and you need all four for genuine coverage: the input layer, the inference layer, the output layer, and the downstream impact layer.
Input Layer: Monitoring Prompt Quality and Token Distribution
Most teams skip this layer entirely. That is a mistake, because input-layer drift is often the earliest observable signal of an impending output quality regression, particularly in RAG applications where retrieval quality directly affects what the model receives.
What to track at the input layer:
- Prompt file version hashes, so you can correlate output changes to specific prompt edits
- Token count distribution per request, where sudden spikes indicate inputs your prompts were not designed for
- System prompt versions across model calls, particularly in multi-agent systems and LLM chains
- Basic injection detection signals for user-controlled input fields
Treating prompt templates as versioned artefacts in source control gives you the leading indicator layer that makes root-cause analysis tractable.
Inference Layer: Latency, Cost, and Model Version Telemetry
This is the layer your infrastructure team already understands. P50, p95, and p99 latency per model endpoint. Token cost per request. Model version logging on every call. For teams running vLLM inference servers, these signals are already partially exposed and straightforward to pipe into your existing stack.
The piece most teams miss is OpenTelemetry tracing across full LLM traces. For RAG applications, a single user request may involve retrieval, reranking, and multiple LLM calls in sequence. Without distributed tracing, you cannot tell whether a latency spike is in retrieval or generation. Tools like Datadog LLM Observability plug into this layer with minimal instrumentation overhead.
Output Layer: Hallucination Detection and Semantic Quality Scoring
This is where classical monitoring stops and LLM-specific tooling begins. An evaluation framework built around semantic scoring, not binary pass/fail, is what separates teams with real coverage from teams with false confidence.
Three approaches teams use in practice:
- LLM-as-judge evaluation: route a sample of production outputs to a separate evaluator model with a rubric prompt. Effective, but adds latency and cost.
- Embedding similarity scoring: compare cosine similarity against a golden dataset of reference outputs. Fast and cheap once the dataset is built.
- Human-in-the-loop spot sampling: a QA engineer reviews a random 1 to 2% sample daily. Catches failure modes automation misses, but does not scale alone.
Platforms like Maxim AI and Vertex AI provide native evaluation framework tooling that integrates this scoring directly into your pipeline.
Downstream Impact Layer: Connecting LLM Quality to User Behaviour
This layer is where a quality regression becomes undeniable. User acceptance rate, regeneration rate, session drop-off across user journeys, and support ticket volume for AI-generated content all correlate with output quality.
Emit a model version label and prompt file hash alongside every user interaction event. When a regression occurs, you can filter your behaviour analytics by those labels and identify exactly which deployment cohort drove the change. Splunk Synthetic Monitoring can complement this layer by simulating user journeys end-to-end and catching degradation before real users encounter it.
Prometheus and Grafana for LLM Observability: Build vs Buy
Teams with existing Prometheus and Grafana stacks ask us the same question: can we extend what we already have, or do we need dedicated LLM observability tooling? For the inference layer, extend what you have. For output quality signals, you will eventually need dedicated tooling.
What You Can Build with Prometheus and Grafana Today
yaml
# Custom metrics for LLM observability
llm_request_duration_seconds_bucket  # latency histogram per model + prompt_template
llm_token_usage_total                # counter: model, type (prompt/completion)
llm_request_errors_total             # counter: model, error_type, prompt_template
llm_model_version_info               # gauge: active model versions as labels
In Grafana, build four baseline panels: latency histogram by prompt template, token cost by model and endpoint, error rate by prompt template, and a model version change timeline overlay. Set production alarms on p99 latency exceeding your SLA, cost-per-request spiking more than 40% above your 7-day baseline, and error rate exceeding 2% on any single prompt template.
Where Prometheus and Grafana Reach Their Limit
Prometheus cannot store text outputs, compute semantic similarity, or trace LLM chains through multi-agent systems and agentic workflows. Dedicated tooling becomes necessary when output quality tracking, golden dataset comparison, or prompt management versioning are required.
Comparison: Build vs Buy
Which approach fits your team?
- Using LangChain or LangGraph with agentic workflows? Start with LangSmith.
- Existing MLOps team with Vertex AI? Arize AI fits your operational model.
- Open-source preference? Evidently, AI self-hosted is the right call.
- Small team, low LLM feature count? Extend Prometheus and build a lightweight golden dataset scorer in Python.
Our Take: For most B2B SaaS teams shipping their first or second LLM feature, a Prometheus extension plus a lightweight golden dataset scorer covers 80% of the risk at 20% of the cost of a full dedicated platform. The dedicated platform becomes worth it around the four-to-six LLM feature mark.
Integrating AI Observability into Your CI/CD Pipeline
A QA engineer at a 90-person fintech company told us something that stuck: "We had dashboards for everything. Dashboards are what you look at after something breaks. We needed gates, not dashboards." That is the right frame for production monitoring of LLM-powered features.
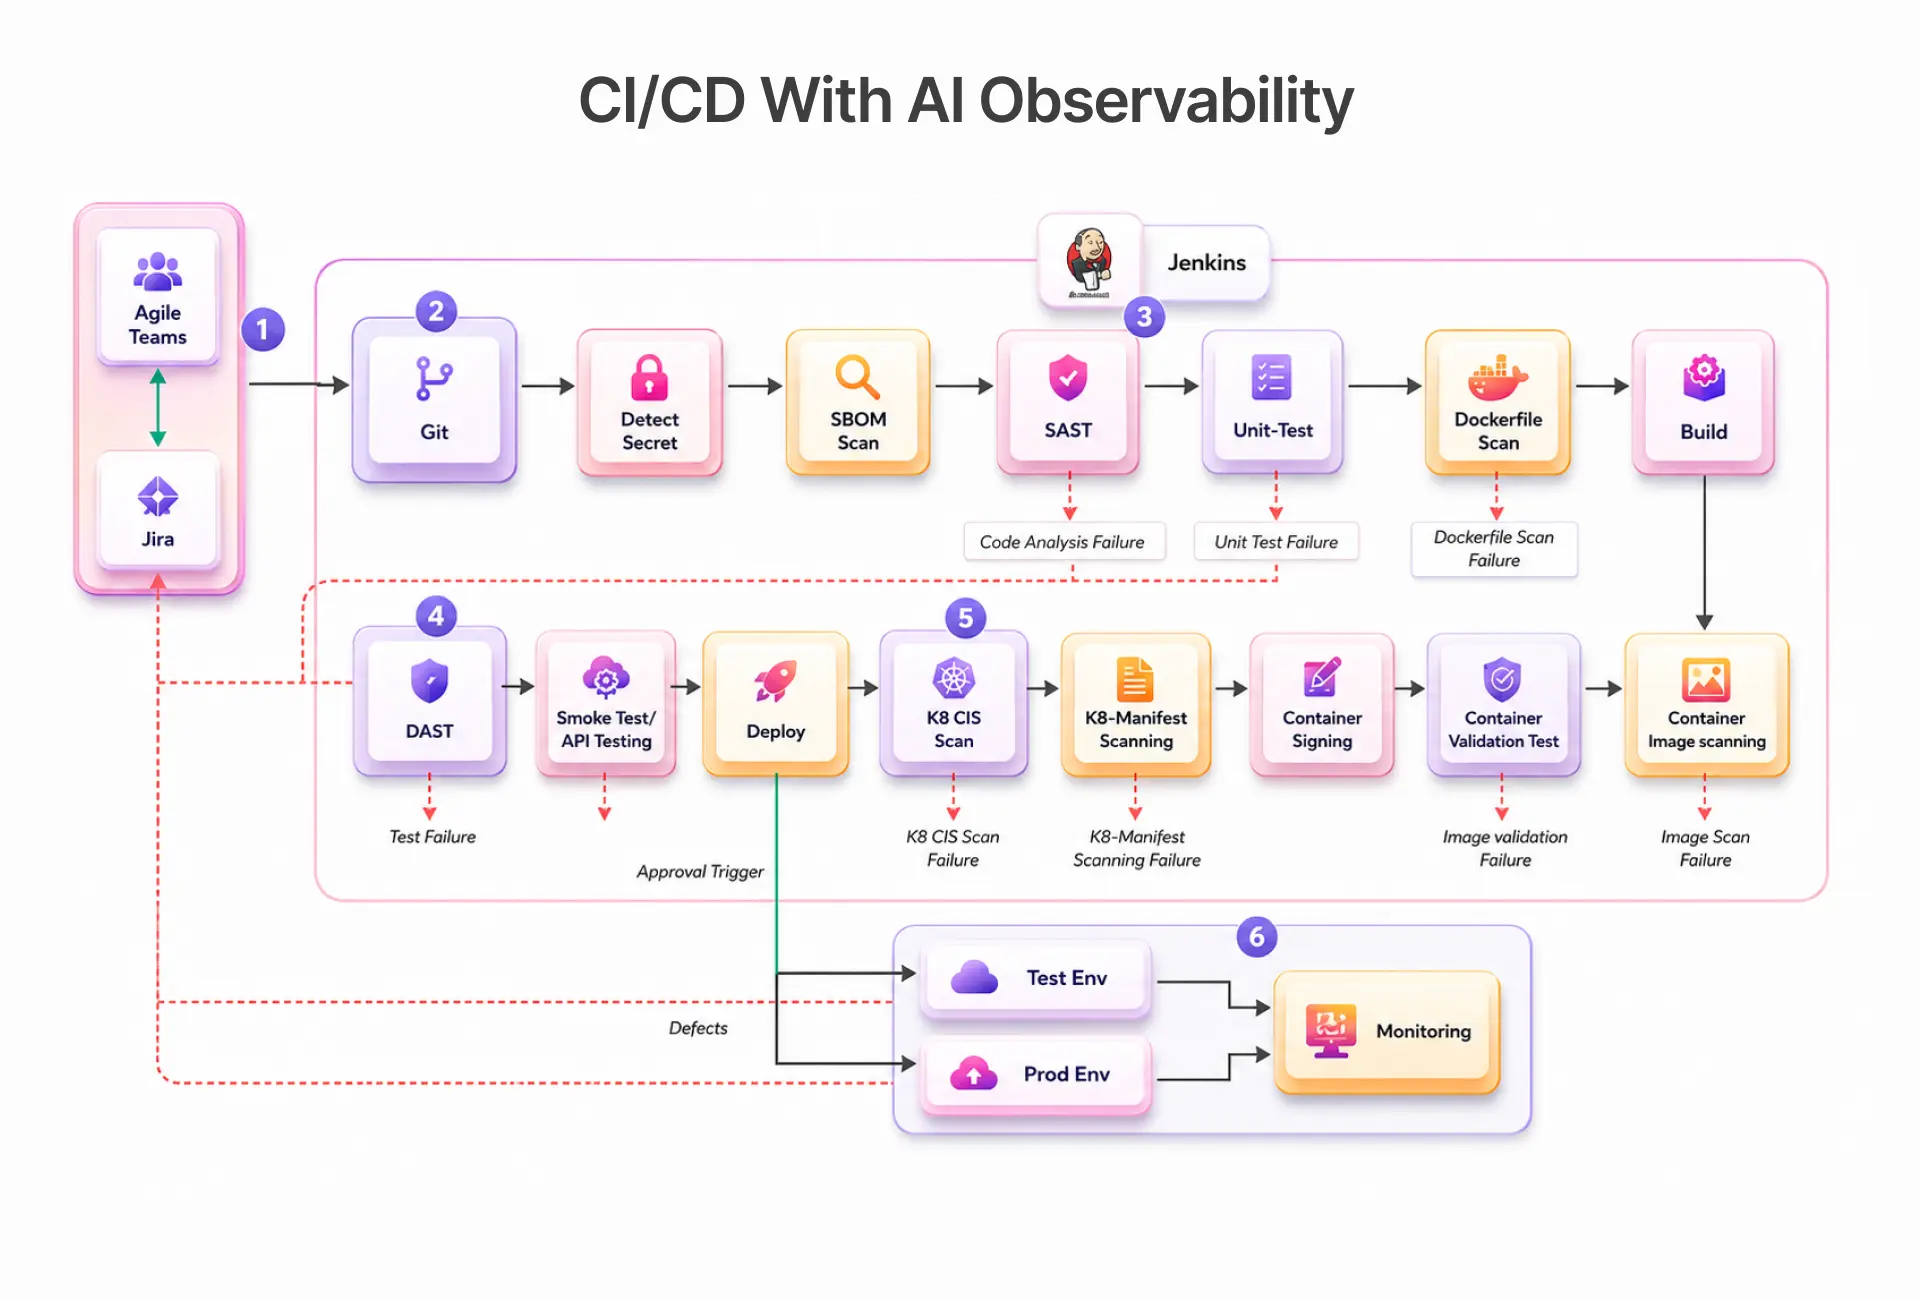
Pre-Deployment LLM Evaluation as a CI/CD Quality Gate
Every pull request touching a prompt file, model configuration, or prompt-driven logic triggers an automated LLM evaluation suite against your golden dataset. If the semantic quality drops below the threshold, the merge is blocked.
yaml
name: LLM Quality Gate
on:
  pull_request:
    paths:
      - 'prompts/**.'
      - 'config/model_config.yaml'
jobs:
  llm-eval:
    runs-on: ubuntu-latest
    steps:
      - uses: actions/checkout@v3
      - name: Run LLM evaluation suite
        run: |
          python scripts/run_eval.py \
            --golden-dataset datasets/golden_v3.jsonl \
            --threshold 0.85 \
            --model-config config/model_config.yaml
Scenario-based testing and agentic simulations extend the golden dataset beyond single-turn inputs to cover multi-step regression testing flows.
Build time: 1 to 2 days for 100 to 200 labelled examples. Full CI/CD integration: 3-5 days.
Post-Deployment Canary Testing for LLM Features
Route 5 to 10% of production traffic to the new model version, score output quality in parallel on both populations, and set automatic rollback triggers if the quality delta exceeds your threshold. Monitor model drift, semantic similarity drift, and downstream user behaviour delta across the canary window.
Agentic AI Testing: Observability Beyond Single-Turn LLMs
Multi-agent systems and agentic workflows, where a single user request triggers a chain of LLM calls across text agents and voice AI interfaces, introduce failure modes invisible to single-turn observability. Model Context Protocol connections and LLM chains compound the tracing complexity further.
According to the OWASP LLM Top 10, goal drift and insecure output handling are among the highest-risk failure modes for production LLM deployments, and both are significantly more prevalent in agentic architectures.
Failure Modes Unique to Agentic Systems
Compounding hallucination is the most under-instrumented failure mode we encounter across agentic simulations and production multi-agent systems. A single hallucinated fact in step two of a five-step chain contaminates every subsequent step. Step-level semantic scoring is the only reliable way to catch it before production.
"Classical monitoring tells you a service is up. AI observability tells you the service is saying the right thing."
Key Takeaways
- Classical monitoring cannot detect LLM quality regressions prompt drift and hallucination failures are invisible to infrastructure tools.
- AI observability requires four instrumentation layers: input, inference, output, and downstream user impact.
- Prometheus and Grafana cover the inference layer. Output quality tracking needs a dedicated LLM observability tooling at scale.
- Pre-deployment LLM evaluation as a CI/CD quality gate outperforms post-deploy production monitoring alone.
- Multi-agent systems and agentic workflows introduce failure modes that single-turn observability misses entirely.
- Build LLM observability before your first production incident, not after.
Conclusion
The gap between "our tests passed" and "our LLM is working correctly in production" is not a testing problem. It is an observability problem. Classical monitoring was built for deterministic software and traditional ML models. Generative AI and large language model applications are not deterministic. Closing the gap means instrumenting the four layers that matter, building a golden dataset from real production inputs, and treating output quality as a deployment gate rather than a post-deploy dashboard metric.
Teams that build QA automation in CI/CD pipelines for LLM quality early ship model version upgrades and prompt management changes with confidence. Teams that skip it find out about regressions from support tickets. The tooling is mature enough to implement without a dedicated MLOps team. What it requires is the decision to treat LLM output quality as a first-class engineering concern. The cost of getting it wrong in production is consistently higher than teams expect.
People Also Ask (FAQs)
Q1.What is the difference between LLM monitoring and LLM observability?
Ans: Monitoring is reactive: you alert when a known metric crosses a threshold. Observability is exploratory: you have the telemetry to ask new questions about why the system behaved a certain way. For LLM features, you need both, but observability is harder to build and more important to prioritise first.
Q2.Can we use our existing Datadog or Grafana stack for LLM observability?
Ans: Yes, for latency, cost, and error rate signals. Datadog LLM Observability extends inference-layer coverage further. For output quality tracking or semantic distribution comparison, dedicated tooling is still required.
Q3.How do you build a golden dataset for LLM evaluation?
Ans: Curate inputs from actual production traffic, label acceptable and unacceptable outputs, and set semantic similarity thresholds from your baseline model performance. Synthetic inputs consistently catch fewer real regressions than production examples.
Q4.How do you test LLM features in CI/CD without slowing down the pipeline?
Ans: Use a two-tier approach: a fast suite under five minutes on every pull request, and a full evaluation run of 30 to 60 minutes gated before production deploy. Parallelise LLM evaluation calls to minimise wall-clock time.
Q5.What OWASP or compliance standards apply to LLM observability?
Ans: The OWASP LLM Top 10 covers LLM02 and LLM09 as the most relevant risks. The NIST AI Risk Management Framework provides a broader governance structure. Output scoring logs and prompt management history serve as evidence for SOC 2 and FedRAMP audits.

.webp)