


A service passes every check in CI. Staging looks clean, unit tests are green, and the release gets signed off without a second thought. Then real traffic hits production, and pods start getting OOMKilled within minutes. The code was tested thoroughly. What the cluster does under that load was never tested.
Kubernetes load testing checks whether a containerised application keeps its performance as pods scale under production-level traffic on the Kubernetes container orchestration platform, capturing real autoscaling behaviour and resource utilization instead of guessing. This guide covers what genuinely changes versus testing on a VM, how to structure a test that tells you something, and which tool fits your team.
What Is Kubernetes Load Testing?
Kubernetes load testing tests two things at once: The application's behaviour under traffic (response time, error rates, throughput), and the infrastructure's reaction (scheduler decisions, HPA behaviour, resource utilization). A generic load test only measures the first half. This one also asks whether the cluster scaled the way it was supposed to, and how long that took.
Load Testing vs. Stress Testing in Kubernetes
Load testing vs stress testing comes down to intent: Readiness or a breaking point. That's the difference between load and stress testing, and Kubernetes stress testing pushes until HPA hits its ceiling.
Why Load Testing Behaves Differently in Kubernetes
Three things change the equation compared to testing a monolith on a VM, and each is easy to miss until it produces a confusing result, especially once you're load testing microservices with a dozen services calling each other.
- Pod scheduling: Decides where a workload lands, and that placement affects what it competes with for CPU and memory on the same node.
- Shared node resource contention: Happens when a load-generator pod lands beside the service under test, quietly skewing results toward a false application bug, and a tightly packed cluster hides this in a way a looser one wouldn't.
- Network overhead: Service mesh sidecars add latency a VM-based test never sees, particularly across a distributed architecture spanning many service-to-service hops.
The HPA Feedback Loop During a Test
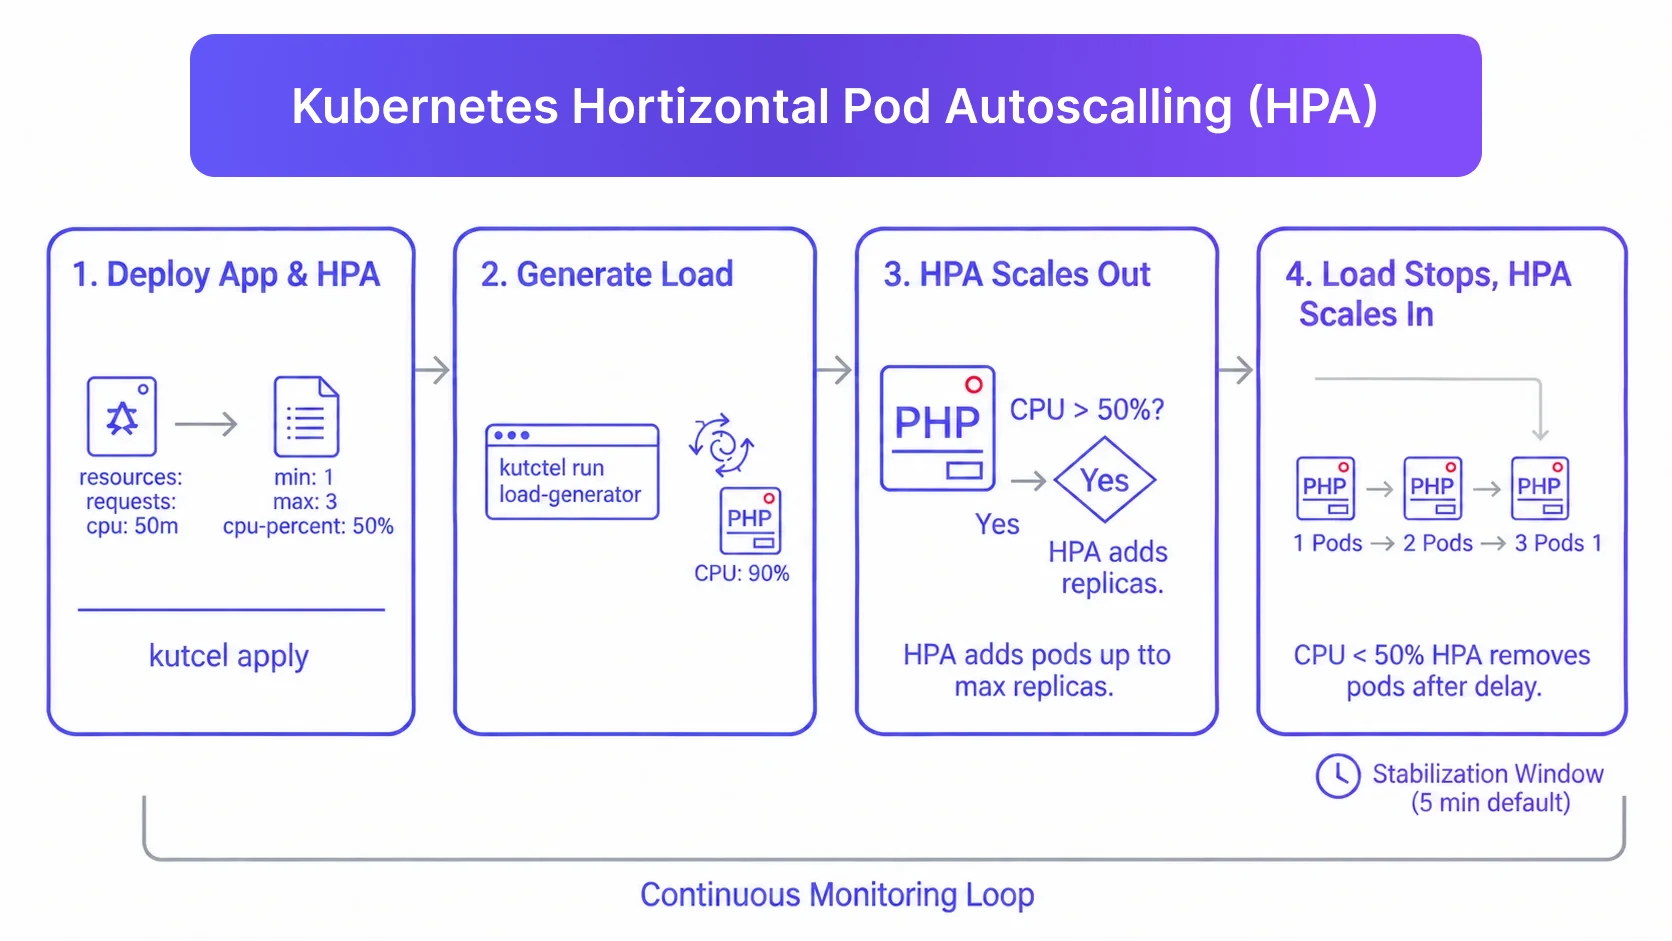
HPA, short for Kubernetes horizontal pod autoscaling, doesn't scale symmetrically, which trips up first-time Kubernetes autoscaling testing efforts. By default, it polls metrics every 15 seconds and can scale up within one to three cycles once a threshold is crossed.
Scaling down works differently. Say a test ramps from 20 to 200 requests per second, then drops back to baseline. HPA holds the higher pod count for the next five minutes regardless, due to a stabilisation window built in to prevent flapping. That lingering pod count isn't a bug.
This matters for how you run the test. Stop generating load and end the test window immediately, and you'll miss the scale-down phase, with no way to tell whether the cluster shed capacity cleanly. Extend the observation window past the last request by at least the stabilisation period instead.
Our Take: Teams that only check pod count at test start and end miss the most informative part of the run. Watching HPA behaviour during ramp-down tells you more about real-world resilience than the peak number ever will.
How to Load Test a Kubernetes Application
Getting a useful result starts with a realistic scenario, not a number from a roadmap meeting. Once that's scripted, running the test follows a defined sequence, not pointing a tool at an endpoint and hoping for the best.
Setting Up Realistic Test Scenarios
There's a real difference between a scenario with think time, meaning simulated pauses between actions, and a zero-delay request flood. The second is a stress test wearing a load test's clothes, giving numbers that look alarming for the wrong reasons. Script full test workflows that mirror real user journeys instead: Login, browse, checkout. Hammering one endpoint repeatedly tells you almost nothing about realistic traffic shape, and it's the most common mistake first-time testers make. AWS Consulting Services can also help teams design realistic cloud-based testing strategies that account for infrastructure behavior and expected traffic patterns.
With scenarios scripted, run the test in this order:
- Define the baseline first: 10 to 50 virtual users, not your projected peak traffic.
- Increase load in 2 to 3x steps, recording where response time or error rates first shift.
- Include spike testing and volume testing passes alongside a steady climb, since each surfaces different failure modes.
- Run at least one pass as distributed load testing, generating traffic from multiple pods at once.
Watching Autoscaling and Capacity Under Load
Track pod count alongside response time during the ramp-up itself, not just after the test finishes, since that's where the interesting behaviour happens. This is essentially Kubernetes scalability testing, and it comes down to capacity planning:
- How many pods does the service need at twice the current peak, not just at today's traffic?
- How long does the cluster actually take to get there once demand rises?
- That second question gets skipped constantly, and it's usually the more expensive one to ignore.
- Provisioning lag under real traffic is what causes an outage, not the peak number itself.
Picking the Right Load Testing Tool for Kubernetes
Tool choice comes down to how your team writes tests and how deep CI/CD integration goes. Most pick from open-source load testing tools; the right load testing tool depends on which Kubernetes testing tools engineers can maintain.
1. k6
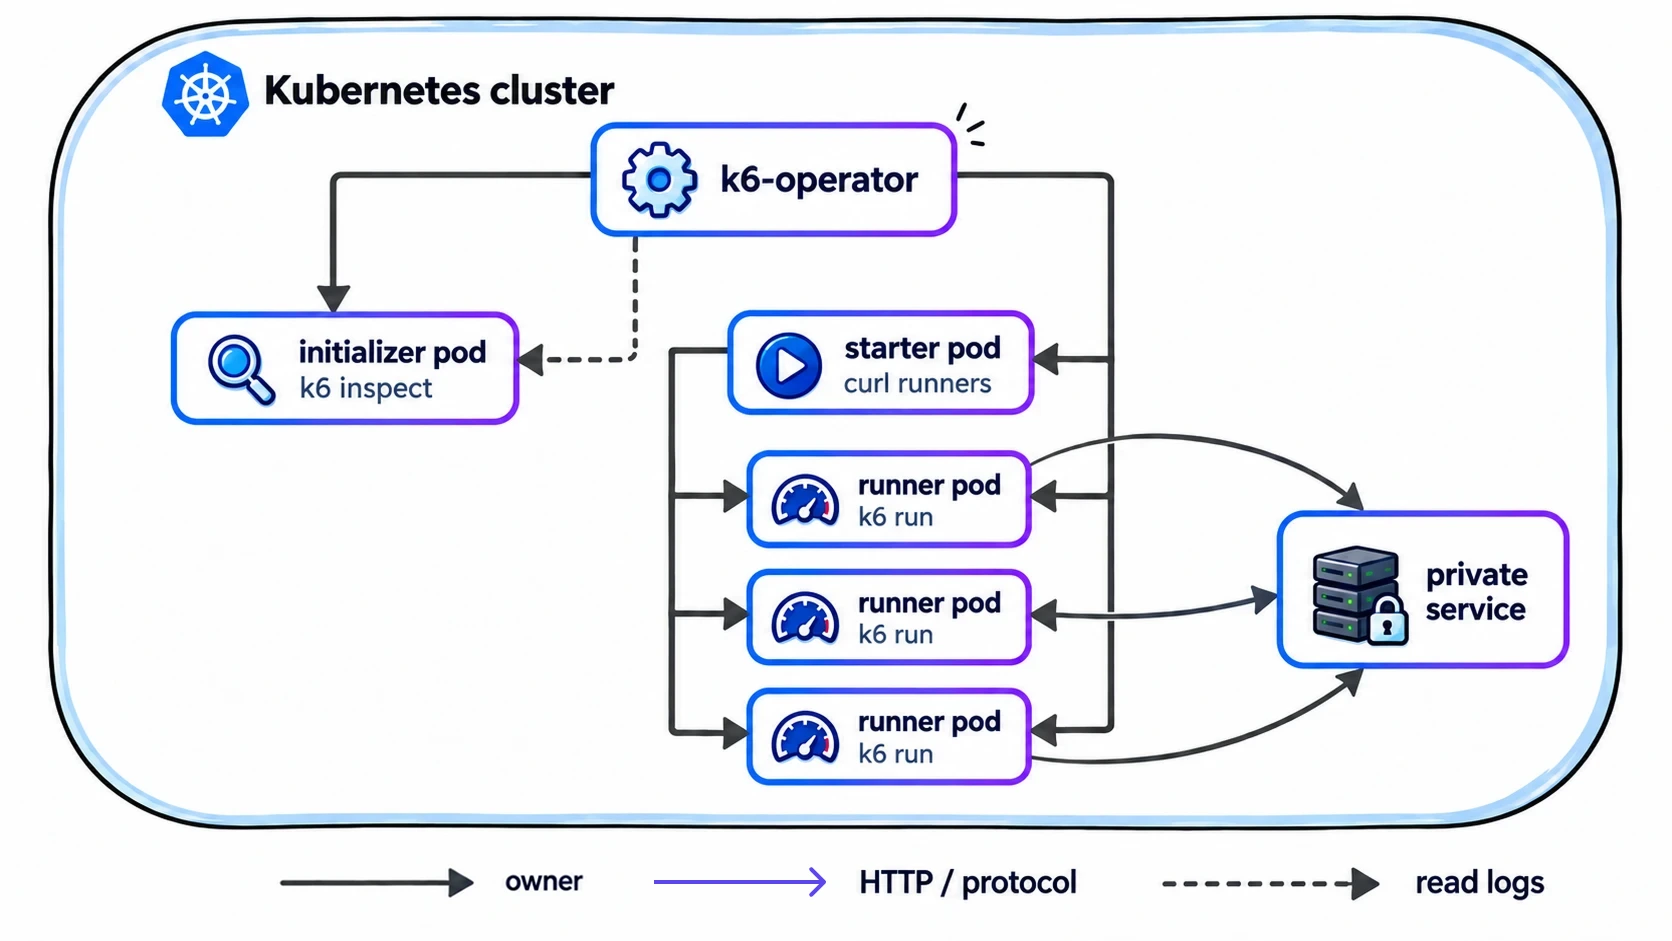
k6 is the default choice for teams writing tests in JavaScript who want k6 load testing wired into CI/CD. Grafana Labs' native k6 operator runs k6 Kubernetes workloads as custom resources, spreading virtual users across pods. K6 performance testing results export cleanly into Prometheus and Grafana, though k6 favours HTTP and gRPC over legacy protocols.
2. Apache JMeter
Apache JMeter has been the industry default for load testing for over two decades, with protocol coverage spanning HTTP, JDBC, JMS, and LDAP, configurable through a GUI or XML plans. It has no native Kubernetes support, so distributed execution usually means a custom Helm chart. Existing JMeter libraries get immediate value; fresh setups find it slower to maintain.
3. Locust
Locust load testing suits Python-heavy teams who want scenarios written as plain Python classes rather than a domain-specific language. It runs as master and worker pods via Helm, distributing simulated users for genuinely distributed load testing. Custom logic is easier to express here than in most competing tools, though the web UI is basic compared to k6's.
k6 vs. JMeter vs. Locust
Kubernetes Monitoring During Load Tests
The signals that separate an application bug from an infrastructure limit are specific, and most teams only watch for them after a test has already gone wrong. Solid Kubernetes monitoring solutions make this visible before a launch turns it into an incident.
- Pod CPU and memory approaching their configured limits.
- OOMKill events and container restart frequency during the run.
- Error rates climbing before latency visibly does.
- Amazon EKS and Google Kubernetes Engine expose different autoscaler timing, so baseline on the actual platform.
Wire load test output into the Prometheus and Grafana dashboards your Cloud Operations team watches for Kubernetes cluster monitoring, and store run history in Cloud Storage so future runs feed real regression detection. Tracked consistently, these signals form the core of Kubernetes monitoring best practices and a real Kubernetes performance benchmark for Kubernetes cluster performance over time.
Best Practices for Kubernetes Load Testing
Most Kubernetes load testing problems trace back to testing hygiene, not tooling choices. Treat these as ongoing performance optimization work, including proper Kubernetes dns configuration, revisited every quarter rather than a checklist you run once.
- Run the load generator on its own node pool, so it doesn't compete with the service under test for CPU.
- Set pod requests to match real observed usage, not arbitrary defaults, since HPA reacts to requests, not limits.
- Fix pass and fail thresholds before the test runs, and re-run the baseline after any HPA or node-sizing change.
- Running Amazon ECS alongside EKS behind shared Load Balancers, particularly an Application Load Balancer, means keeping thresholds consistent, or results won't compare.
- A rate limiter or WAF is a security service that only proves itself under real traffic; test that security solution alongside performance.
- Treat the workflow as a load test automation system wired into CI/CD, using automated performance testing tools and agentic AI workflows to flag anomalous runs for a human to review.
How Frugal Testing Helps You Load Test Kubernetes Applications, Without the Overhead
As a DevOps consulting and performance testing services partner, most failures we see aren't a bad tool choice. They're a test suite nobody has maintained since it was built, drifting out of sync with the application until a launch or incident exposes the gap, costing more than maintaining it would have.
We work embedded with QA and engineering teams to close that gap, starting with an audit of the traffic patterns your application sees in production, and ending with a working test suite the team can run and maintain on its own, without needing us in the room every release.
What Our Kubernetes Load Testing Engagement Looks Like
- Week 1: Traffic pattern and protocol audit, mapping what real production traffic actually looks like.
- Week 2: Tool selection or tuning, and building or adapting scripts to match the team's existing skill set.
- Week 3: CI/CD integration with defined pass and fail thresholds, the DevOps automation consulting piece, wired into the pipeline rather than run manually.
- Week 4: Handover with documented thresholds and a runbook the team owns and can maintain going forward.
Who This Is For
This fits DevOps Kubernetes teams shipping services who need load testing wired into CI/CD but lack a dedicated performance engineer, whether that means qa outsourcing services or extra in-house support, especially post-incident, before a launch, or once a suite has gone stale.
Conclusion
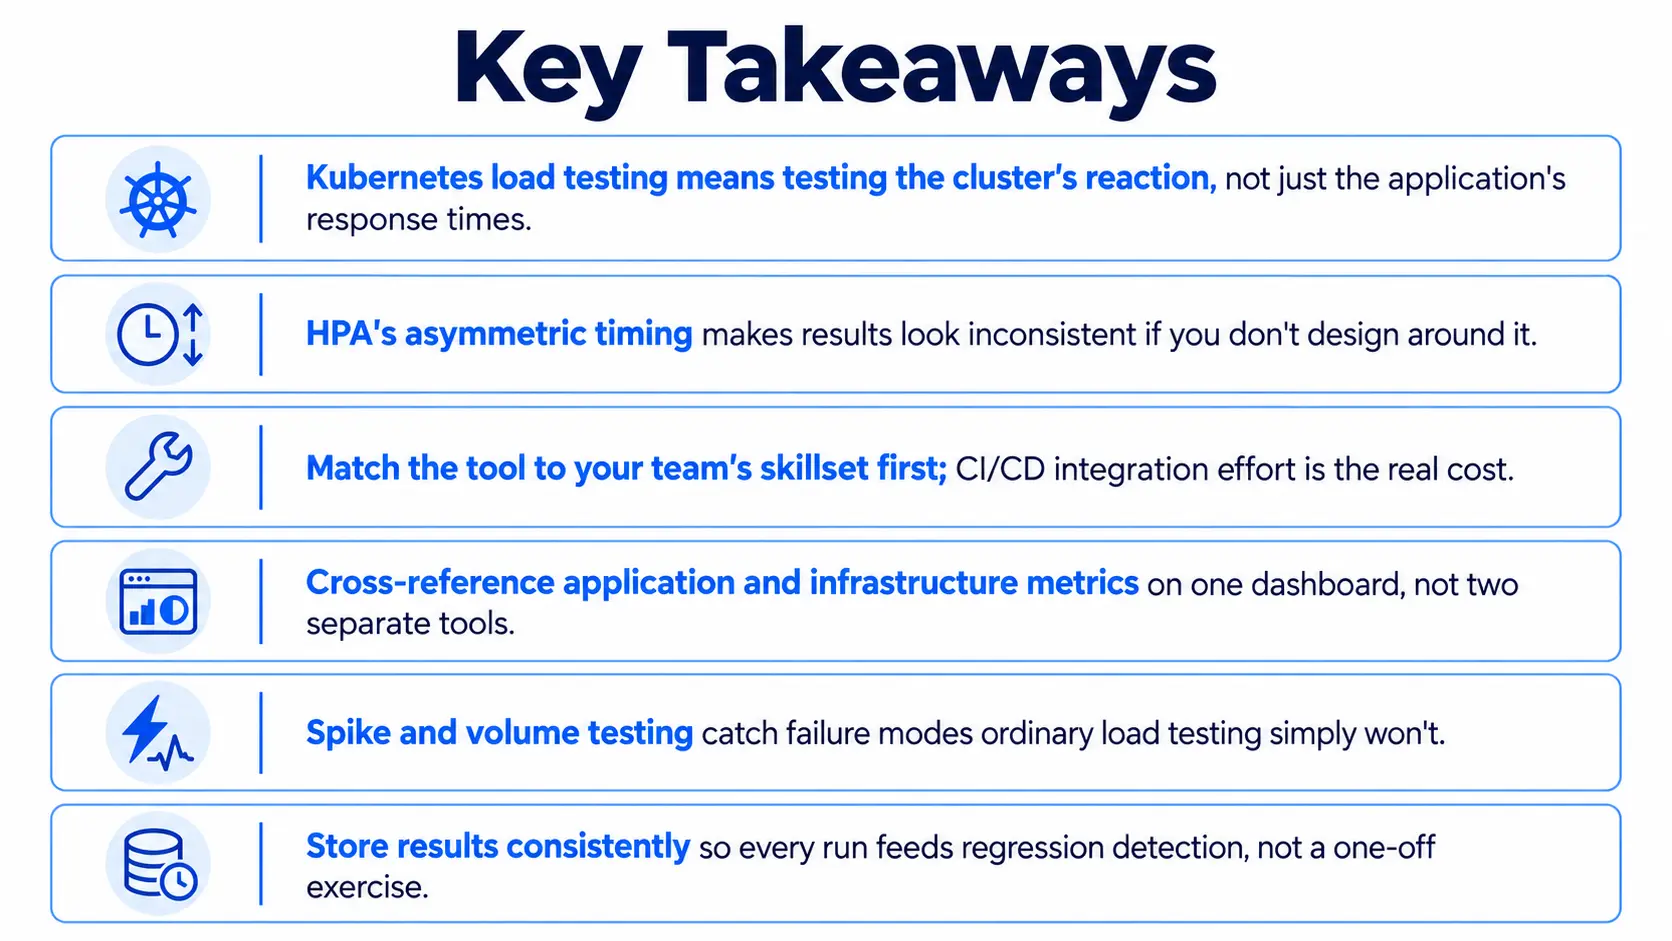
Kubernetes load testing only pays off when it tests the cluster, not just the app. Watch HPA's asymmetric scale-down window, pick a tool your team can actually maintain long-term, and wire monitoring into the same dashboards your engineers already trust and check daily.
Get those three right, and load testing stops being a pre-launch checkbox nobody revisits. It becomes the reason your next traffic spike turns into a routine graph, not an incident review, and that's worth more than any single benchmark number ever will be.
People Also Ask (FAQs)
Q1. What is load testing actually protecting for the business?
Ans: Load testing simulates expected user traffic to catch failures before customers do, protecting revenue, uptime, and release timelines instead of just confirming a demo environment works.
Q2. What is capacity planning worth to a growing engineering budget?
Ans: Capacity planning forecasts the compute a system needs ahead of demand; a capacity planning tool automates the forecasting so budgets don't lag behind actual growth.
Q3. Can load testing actually lower our Kubernetes cost monitoring bill?
Ans: Yes. Load test data feeding into Kubernetes cost monitoring often reveals over-provisioned requests, turning a performance exercise into genuine cloud resource optimization work with real budget impact.
Q4. Where should a team start with Kubernetes API load testing on a budget?
Ans: Start with your highest-traffic, highest-revenue endpoint rather than testing everything at once. Kubernetes API load testing pays off fastest when it targets the calls customers depend on.
Q5. Does a standard load testing framework reduce vendor lock-in risk?
Ans: Somewhat. Most teams build a load testing framework around k6 or JMeter, both open source, so switching providers or bringing testing in-house later doesn't mean starting from zero.

.webp)