Most performance issues don't show up during development. They show up at 2 AM when traffic spikes and your app falls over under load you never actually tested for. We've seen this with teams that had solid test coverage but zero load tests, one traffic surge and everything buckles. Shift-left performance testing exists to close that gap, catching bottlenecks before they become production incidents.
That's exactly what k6 was built for. It's open-source, written in Go for raw speed, and scripted in JavaScript which means your developers and SDETs can write load tests the same way they write application code. No new language to learn, no steep onboarding curve.
What separates k6 from older tools like JMeter isn't just syntax. It's philosophy. k6 is designed to live inside your existing CI/CD pipeline, run from your terminal, and simulate realistic user traffic without heavy setup overhead. You define how users behave, k6 executes it at scale, and you get hard numbers, response times, error rates, throughput before a single line ships to production.
This tutorial walks you through everything from writing your first test script to running distributed load tests the right way.
What We Will Cover in This Guide
- The Core Architecture: Simulating thousands of virtual users without sucking out the resources in your system, k6 takes minimal resources to run.
- Setting Environment: Preparing your immediate environment, and writing your first Load-testing script.
- Realistic Traffic Simulation: Running Scenarios to simulate load stages and user traffic the way they should be.
- Reading the Data: Which performance metrics actually matter, and how to interpret response time and error rate results.
- Scaling Up: Moving from local tests to k6 Cloud and wiring automated checks into your CI/CD pipeline.
What Is k6 and How It Works
k6 runs a Go execution engine under the hood. You write tests in JavaScript. Go handles the concurrency and raw throughput , JavaScript gives your team a scripting interface they already know. The result: you can simulate thousands of virtual users from one machine without it grinding to a halt. Most load testing tools need serious infrastructure to hit that kind of concurrency. k6 doesn't.
Understanding Load Testing and Stress Testing with K6
Load testing checks how your system performs under expected traffic. You configure a realistic number of virtual users, run them through typical user flows, and measure response time and error rate under normal operating conditions.
Stress testing pushes past that. You scale virtual users beyond normal capacity to find where the system breaks and more importantly, how it recovers when it does. Both use the same k6 framework. The difference is intent.
Why k6 is Popular: Benefits for API and Web Performance Testing
The honest answer is developer experience. k6 tests are plain JavaScript files. You write them, version-control them, and run them from the CLI the same way you'd run any other script. That makes it easy to drop into an existing CI/CD pipeline without convincing anyone to adopt a new tool.
A few things stand out in practice:
- Low Overhead: One machine can simulate serious traffic against an API endpoint without additional infrastructure.
- Scalability: Tests scale from a simple single-endpoint check to a full multi-service flow.
- No Setup Friction: There's no gap between "I want to write a test" and actually running one.
k6 Tutorial: Setting Up Your Testing Environment and Running Tests
Getting k6 running takes a few minutes. You have three options: local install, Docker, or a cloud environment and all of them work fine for getting started.
Prerequisites and Initial Test Setup
On macOS, run brew install k6. On Debian-based Linux, use sudo apt-get install k6. If you prefer containers, docker pull grafana/k6 works fine.
k6 has its own runtime, so Node.js isn't required to run tests. That said, installing it gives you better autocomplete in VS Code when writing test scripts worth the five minutes.
Writing and Running Your First k6 Test Script
Every k6 test moves through three stages:
- Initialization: k6 loads the script, parses your config, and prepares the environment. Nothing runs yet.
- Execution: Virtual users run your test function which endpoint to hit, what headers to send, how long to wait between requests.
- Teardown: When the timer hits zero, k6 wraps up, releases resources, and outputs the final metrics.
Now here's what that actually looks like in code:
import http from 'k6/http';
import { sleep, check } from 'k6';
export const options = {
  vus: 50,
  duration: '30s',
};
export default function () {
  const res = http.get('https://your-api-endpoint.com/api/v1/users');
  check(res, {
    'status is 200': (r) => r.status === 200,
    'response time < 500ms': (r) => r.timings.duration < 500,
  });
  sleep(1);
}
Save it as load-test.js and run:
k6 run load-test.jsYour terminal shows live output immediately, requests per second, response time, failure rate as 50 virtual users hit your endpoint simultaneously. No dashboard setup, no config file, no boilerplate.
Running Spike and Scalability Tests Using k6 Scenarios
Throwing a fixed number of users at a system all at once isn't realistic. Real traffic ramps up, holds, then drops. k6 handles this through staged load profiles:
- Ramp-up: Gradually increases virtual users to simulate a traffic surge.
- Steady State: Holds at peak load to measure sustained performance.
- Ramp-down: Gradually reduces connections until the test ends.
Staging load this way shows how your infrastructure actually behaves under pressure. The ramp is where most systems quietly fall apart flat load tests never catch it.
Understanding k6 Performance Metrics and Test Results
After every test, k6 prints a summary to your terminal. The instinct is to look at average response time first. That's the wrong instinct - a flat average hides outliers that are actively breaking user experience for a portion of your users.
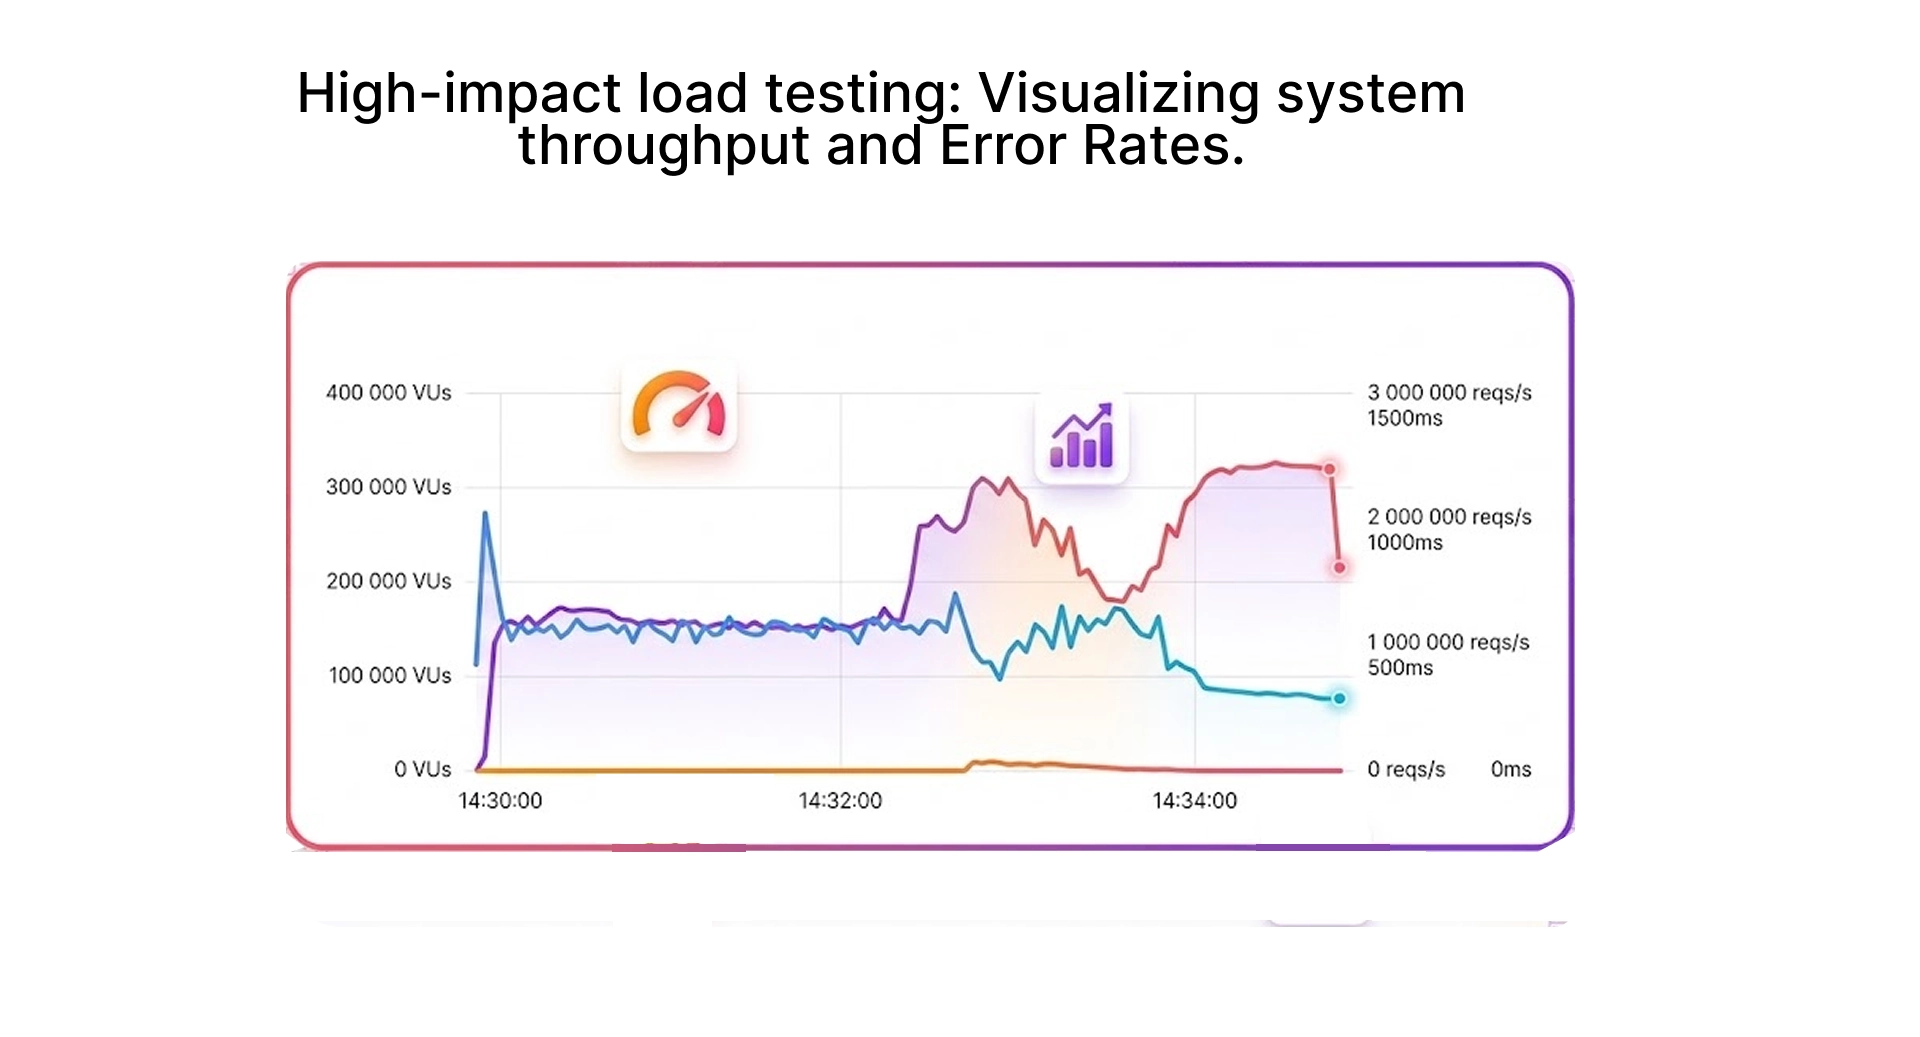
Analyzing Response Time and System Throughput
The metric that matters is http_req_duration at the 95th percentile written as p(95). If your p(95) is 400ms, 95% of requests are completed within that window. A mean of 200ms paired with a p(95) of 1,200ms tells a completely different story about your system than the average alone would suggest.
- http_req_duration: Tracks the actual time each request takes to complete, end to end.
- Throughput: Divide total requests by test duration against active virtual users to get real requests per second.
- Percentiles: Use p(90) and p(95) as your primary benchmarks, not the mean.
Setting k6 Thresholds for Automated Performance Checks
Manual review doesn't catch gradual regressions. Thresholds let you define hard pass/fail criteria that k6 enforces automatically:
export const options = {
  thresholds: {
    http_req_duration: ['p(95)<400'],
    http_req_failed: ['rate<0.01'],
  },
};
This fails the test if 95% of requests don't complete within 400ms, or if the error rate exceeds 1%. Wire this into your CI/CD pipeline and you have an automated performance gate on every build . Degraded code that doesn't reach production.
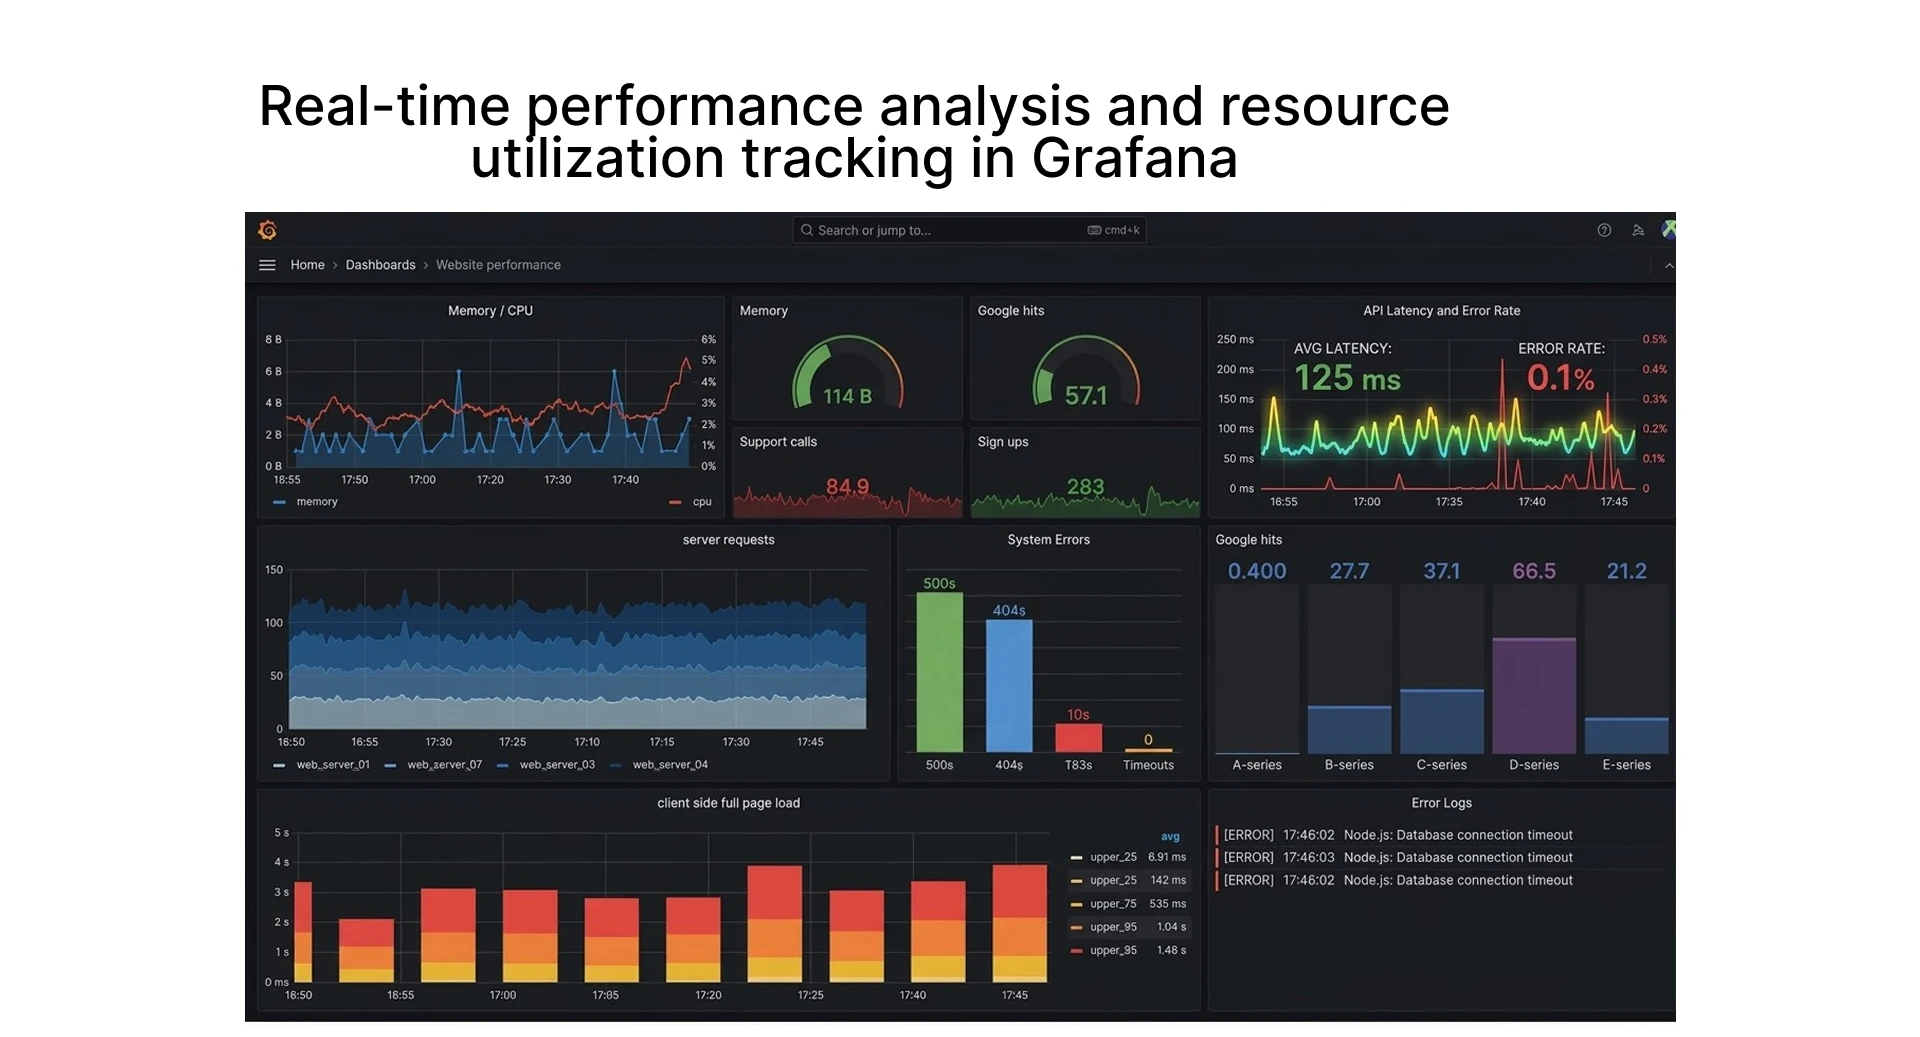
Visualizing Test Results with Grafana Dashboards
Terminal output works for quick checks. For anything longer or when you need to track trends across multiple builds stream metrics to InfluxDB and visualize in Grafana. k6 supports this natively with a single output flag on your run command.
The Grafana k6 dashboards give you live test monitoring, instant error rate visibility, and system behavior under sustained load in one view.
Scaling Performance Tests Using k6 Cloud
At some point, a single machine hits its limits. CPU and memory cap out before you reach the traffic volume that reflects real production load. That's when k6 Cloud makes sense.
Advanced Test Planning for Large Test Scenarios
Local tests aren't enough when you're preparing for a major traffic event, a product launch, a sale, or a sudden spike from press coverage. You need a distributed platform that models traffic from multiple geographic regions simultaneously.
- Global Distribution: Run scenarios with tens of thousands of virtual users without hardware limits.
- Orchestration: Teams on Kubernetes use the k6 operator to manage large distributed runs natively inside existing infrastructure.
- Realism: Your infrastructure faces traffic patterns that match real global users, not requests originating from a single machine.
Continuous Performance Monitoring and Server Health
A one-off load test has limited value. A test that runs on every deploy and alerts when performance drops - that's genuinely useful.
Connecting k6 to GitHub Actions on a schedule gives your team a performance baseline they can track over time. Even a lightweight smoke test on your three most critical endpoints will catch regressions that unit tests miss entirely. You might also find that the endpoint you expected to be slow is actually fine and the real bottleneck is somewhere upstream you weren't watching. That happens more often than you'd expect.
Pair that with Prometheus and OpenTelemetry for server-side metrics and you can correlate exactly what the server was doing when response times spiked. Client-side HTTP metrics plus server resource data in one view is where performance debugging gets fast.
Conclusion: Best Practices for Getting Started with k6
Don't try to cover everything at once. Pick your two or three most critical API endpoints, write a basic load test for each, and run them locally first. Once you see what your system actually does under 50 concurrent users, the next steps become obvious.
A few things worth establishing from day one:
- Establish Absolute Pass/Fail Standards: Set thresholds early. Gut-feel review doesn't catch gradual degradation.
- Automate Everything: Wire checks into your CI/CD pipeline before you have a regression to catch otherwise the gate isn't there when you need it.
- Pay Attention to the End-User: Use p95 response time as your primary metric. Averages hide the users who are actually having a bad experience.
Scaling Performance Testing with Frugal Testing and Buildnextech
Moving from local scripts to a distributed cloud platform sounds straightforward until your first major load test exposes bottlenecks you never saw coming. Migrating legacy JMeter suites adds another layer of complexity, especially when your team is already stretched thin. That's where Frugal Testing and Buildnextech come in book a free consultation to get a direct audit of your performance setup and a scaling plan built around your stack.
Beyond the basics, they handle the pieces most teams skip k6 strategies wired into your CI/CD pipeline, coverage extended to gRPC and WebSocket connections, and full Browser Testing under real load conditions. Whether you're running Selenium for integration coverage or Playwright for end-to-end flows, the goal stays the same your application holds up when it matters most.
Quick Recap: Your Path to Better Performance
- Core Architecture: k6 uses a Go engine and JavaScript scripting to run efficient, high-concurrency load tests from a single machine.
- First Test Script: Staged load profiles let you simulate real traffic patterns, not just flat user counts.
- Key Metrics: p95 response time and error rate are what matter not averages.
- Scaling: k6 Cloud and CI/CD integration take local tests into production-grade continuous monitoring.
People Also Ask (FAQs)
Q1.What is k6 used for in performance testing?
Ans: k6 load tests APIs and backend services under simulated user traffic. It's particularly useful for catching performance regressions before they reach production.
Q2.Is k6 better than traditional load testing tools?
Ans: For teams that write code, yes. k6 tests are plain JavaScript, run from the CLI, and use significantly fewer resources than GUI-heavy Java-based frameworks. JMeter has a broader plugin ecosystem and works better for non-developer teams that's the relevant tradeoff.
Q3.Do I need programming knowledge to use k6?
Ans: Basic JavaScript is enough. If you can write a function and a conditional, you can write a working k6 test.
Q4.What types of performance tests can be done with K6?
Ans: Smoke, load, stress, spike, and soak tests. Each targets a different failure mode smoke tests catch obvious breakage on deployment, soak tests surface memory leaks that only appear after hours of sustained load.
Q5.Can k6 test APIs and web applications?
Ans: The core tool tests at the protocol level HTTP, WebSocket, gRPC. For frontend rendering metrics, the k6 browser extension adds real browser execution on top of that.

.webp)