


A sales director quotes a churn figure to the board, and finance spots within minutes that it disagrees with the ledger. The cause sits three systems upstream, in a job nobody thought to check. BI testing is how business intelligence teams prove data is collected, transformed, stored, and reported correctly, so numbers match the source.
Business intelligence teams cannot control what source systems send, yet they are the ones questioned when a dashboard is wrong. Business leaders act on these numbers, so the checks must follow the data from source to dashboard. Nobody outside the team sees the pipeline, only the number on the screen, and a wrong one costs credibility.
What Is BI Testing
BI testing checks every stage of the pipeline behind a report, from source extracts to the final chart. Plain report checking covers only the last stage, so it proves the chart looks right, not that the number underneath it is. Five key components make up a typical pipeline:
- Data sources: Systems that feed the pipeline.
- ETL jobs: Steps that clean and transform data.
- Warehouse: Where data is stored.
- Reports and dashboards: Where people read it.
- Data security: Who can see what.
Finance leads, product managers, and sales ops feel a failure first. According to Gartner, poor data quality costs organisations an average of $12.9 million a year, and the damage compounds when data analytics and machine learning models are built on the same flawed tables.
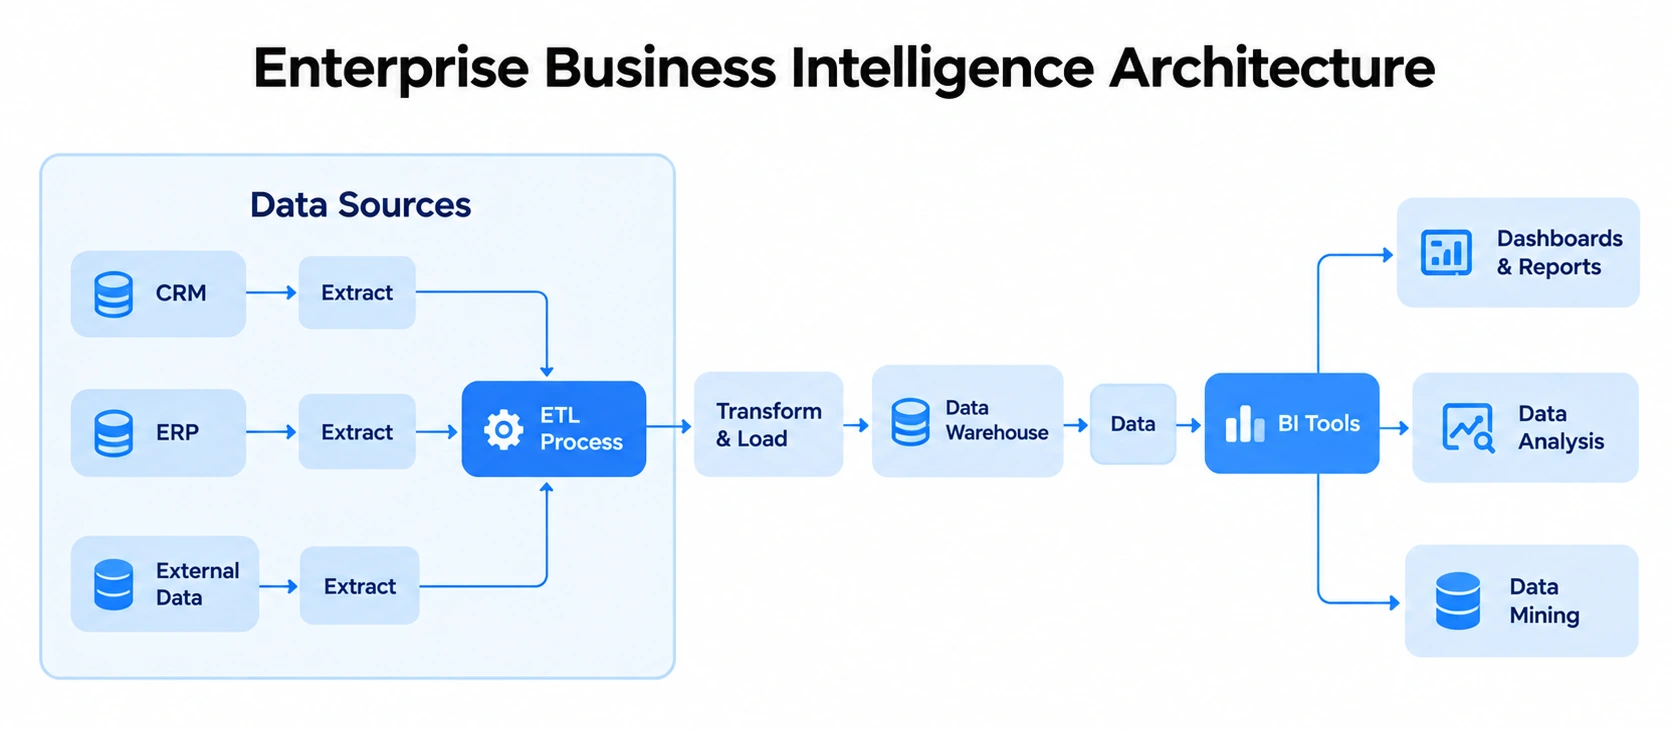
The Two Stages of BI Testing: Data Storage and Reporting
The work splits into two stages. Most teams over-invest in the second because they can see it.
- Back end (data storage): Source data, ETL, and the warehouse. These checks prove data arrives complete, is transformed by the right rules, and loads without loss or duplication (Techniques 1 to 3).
- Front end (reporting): Reports and dashboards. These checks prove each KPI, filter, and permission shows the right figure to the right person (Technique 4).
How to Plan Your BI Testing Before You Start
Most BI testing problems start before the first query runs, when scope, data sources, and pass criteria are left vague. Teams that write these down early spend their time fixing defects instead of debating what counts as a pass. Use the two steps below to set that foundation.
Setting Test Scope and Environment
Decide what is in scope and where you will test it. An unrealistic test environment hides the failures you most need to see.
- Layers in scope: Source, ETL, warehouse, and reports.
- Production-like environment: Match data volume and refresh timing, because a 10,000-row test warehouse passes checks that a 40-million-row one fails.
- Test coverage target: Decide which tables, KPIs, and reports need coverage before sign-off.
- Data migration: When moving platforms, apply data migration reconciliation techniques such as row counts and checksum comparisons.
Preparing Test Data and Quality Criteria
Good test data includes the awkward records that break real pipelines. Quality criteria then define what counts as a pass for each KPI.
- Awkward records: Nulls, refunds, duplicate orders, and late-arriving rows.
- Acceptance rule per KPI: For example, revenue must match the source within an agreed tolerance, written down so nobody has to remember it.
Technique 1: Data Acquisition Testing
Data acquisition testing confirms that the right data leaves the source and arrives intact. It is the cheapest place to catch a problem: A bad extract costs minutes to fix, while a bad quarter's report costs a week.
- Confirm data sources and connections: Check connection strings, credentials, and refresh schedules.
- Check that everything is picked up: Compare record counts against the source.
- Profile the data: Look for nulls, outliers, and data type mismatches.
- Run data validation and data quality testing: Test completeness, uniqueness, and format rules.
Data quality testing methods here are simple: Completeness, uniqueness, format, and range checks. Source data validation is dull work, yet roughly half the strange numbers we see begin here.
Technique 2: Data Integration Testing
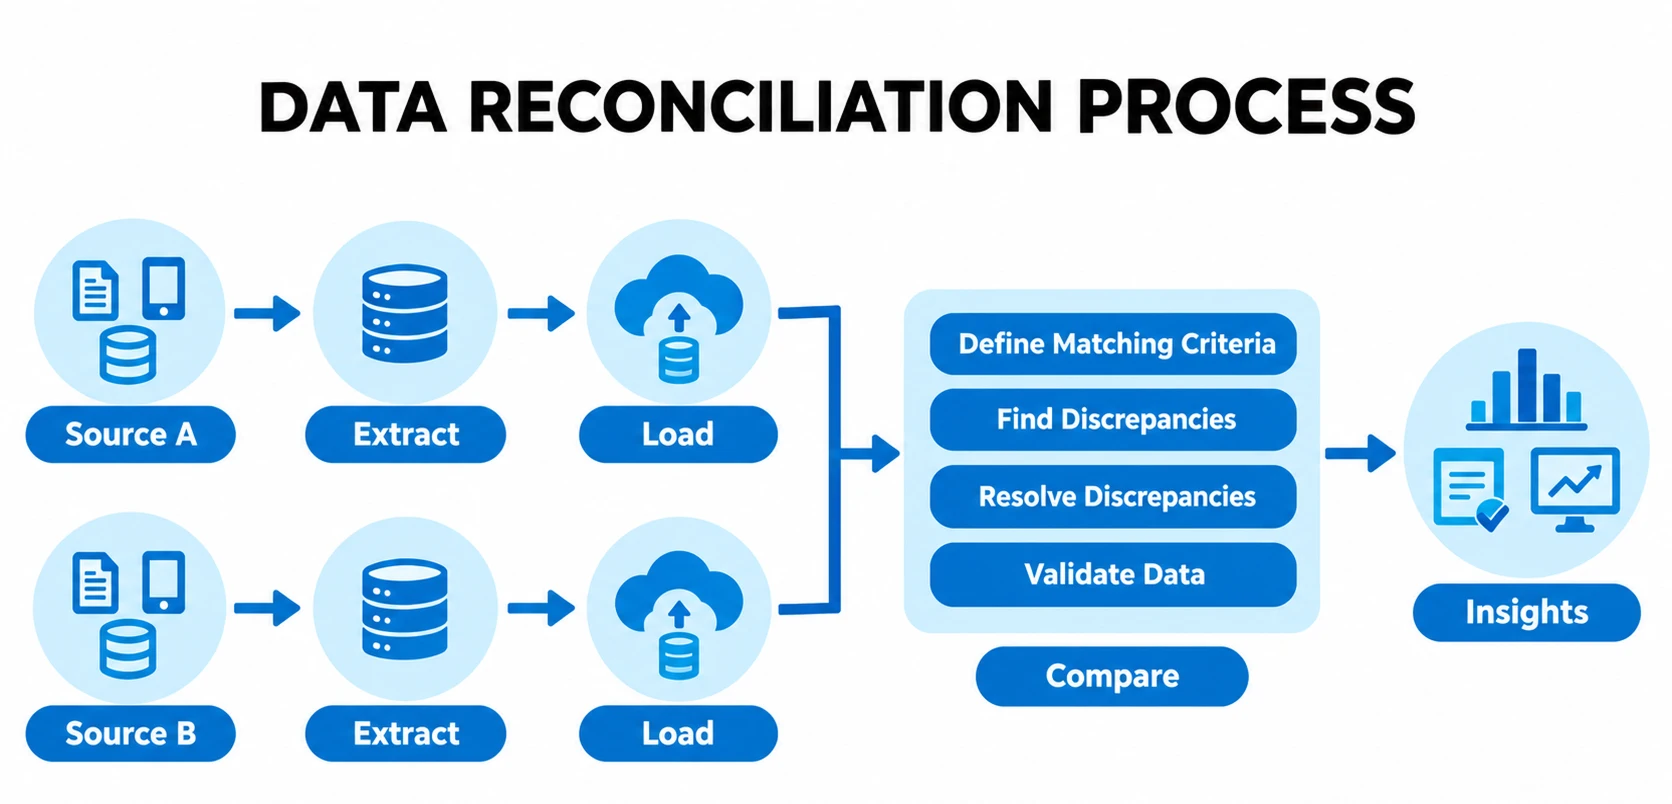
Data integration testing checks that data is transformed correctly between systems, which makes it the ETL testing layer. Its central check is data reconciliation. What is data reconciliation? The data reconciliation meaning is simple: Matching source values to target values and explaining every difference.
- Validate the data model against business requirements: The schema must support the reports people need.
- Review the data dictionary and metadata: Names and definitions must agree across systems.
- Check source-to-target mapping and transformation logic: Test calculated fields, conversions, and filters.
- Run the data reconciliation process: Compare row counts, then totals, then key fields, and keep the results as reconciliation data.
Reconciliation of data at every hand-off would have caught the churn figure that disagreed with the ledger before it reached the board. Teams start with SQL scripts, then adopt a data reconciliation tool or data reconciliation software for automated data reconciliation as checks multiply.
Technique 3: Data Storage Testing
Data storage testing verifies that the warehouse holds the right data after every load. What is a data warehouse? It is the central store of cleaned data for reporting, so lost rows break every report.
Data warehouse testing changes with the design. In a data lake vs. data warehouse setup, test the hand-off, and test any data warehouse services a vendor supplies.
- Validate data loads: Full, incremental, and real-time data processing loads must not drop rows.
- Test query performance and scalability: Run growing volumes, for example on Azure Synapse.
- Verify parallel execution: Parallel jobs must not overwrite records.
- Run compliance checks on archival and purge rules: History must follow policy.
- Verify error logging and recovery: Failed loads must alert and be safe to re-run.
Technique 4: Data Presentation Testing
Data presentation testing confirms that reports show the right numbers to the right people. Report and dashboard testing is the only part business users see, and Power BI testing and Tableau testing follow the same logic.
- Validate KPIs against database queries: Testing KPI dashboard figures means recalculating each one in SQL (KPI validation).
- Check report layout against mockups and requirements: BI report testing covers labels, totals, and drill-downs.
- Test Power BI reports and Tableau dashboards: Power BI report testing covers slicers and refresh in the Power BI Service, while Tableau dashboard testing covers extracts.
- Run end-to-end testing across the whole pipeline: Trace one record from source to chart.
- Run user acceptance testing (UAT) with business users: Agree who signs off and log user feedback.
BI Testing Tools and Automation
Tools fall into groups by the job they do, so pick the job first and the brand second. No single BI testing tool covers every layer, so most teams combine SQL, a data quality framework, and their platform's own checks.
Popular BI Testing Tools
Tableau testing tools are mostly the platform's own extract and permission checks plus SQL. Data quality testing tools such as Great Expectations cover rules and schemas.
Which fits your team? Use the three checks below to decide.
- Already on dbt? Start with dbt tests, then add reconciliation queries.
- Running Informatica or Talend? Use their built-in validation, plus SQL for reconciliation.
- Neither? Begin with plain SQL scripts and add Great Expectations later.
What to Automate and What to Check Manually
Automate the checks that repeat and keep people on the checks that need judgment. A daily report usually justifies automation, while a weekly one rarely does.
- Automate counts, reconciliation, and regression after each refresh.
- Wire automated testing into your DevOps practices so checks run on every release, as our guide to test automation in CI/CD shows.
- Add Power BI automation testing and Tableau automation testing for refresh, KPI, and permission checks after each deployment.
- Use coverage reports so test coverage gaps show up early.
Keep each Power BI test small and named after the KPI it protects. Our test automation work follows the same rule, and it keeps KPI definition review and UAT with people.
Benefits of BI Testing
Benefits show up in decisions before they show up in defect counts. The first of these five outweighs the others.
- Trusted numbers for decisions: Leadership acts on a report without re-checking it in a spreadsheet.
- Fewer reporting errors: Errors are caught before release, not after a decision is made.
- Faster issue detection: Automated checks flag a bad load the same day, not at month-end.
- Better user experience: Filters, load times, and permissions work, so user feedback shifts from complaints to feature requests.
- Lower rework cost: A defect found at the source costs minutes to fix, while one found in a board pack costs days.
How Frugal Testing Helps You Test Business Intelligence Without the Overhead
Frugal Testing provides BI testing services for teams that need their numbers proven, not assumed. Our QA consulting services cover ETL, warehouse and report validation, and you keep a documented set of reconciliation and KPI checks. Across our QA engagements, the most common defect is a filter that behaves differently by role.
We work inside your team rather than handing over a report from a distance, unlike many QA consulting firms. On a warehouse migration, our software QA consulting starts at the first extract, and our QA testing consulting leaves your team with checks it can rerun. Our QA outsourcing guide explains it in more detail.
What Our BI Testing Engagement Looks Like
Here is how a typical mid-sized engagement runs, week by week. Each week ends with something you can review.
- Week 1: Scope and data review: We map your pipeline and agree tolerances.
- Week 2: Test design: We write reconciliation, KPI, and UAT scenarios.
- Week 3: Execution and reconciliation: We run the checks and log defects.
- Week 4: Hand-off: You own the suite, scripts, and documentation.
Conclusion
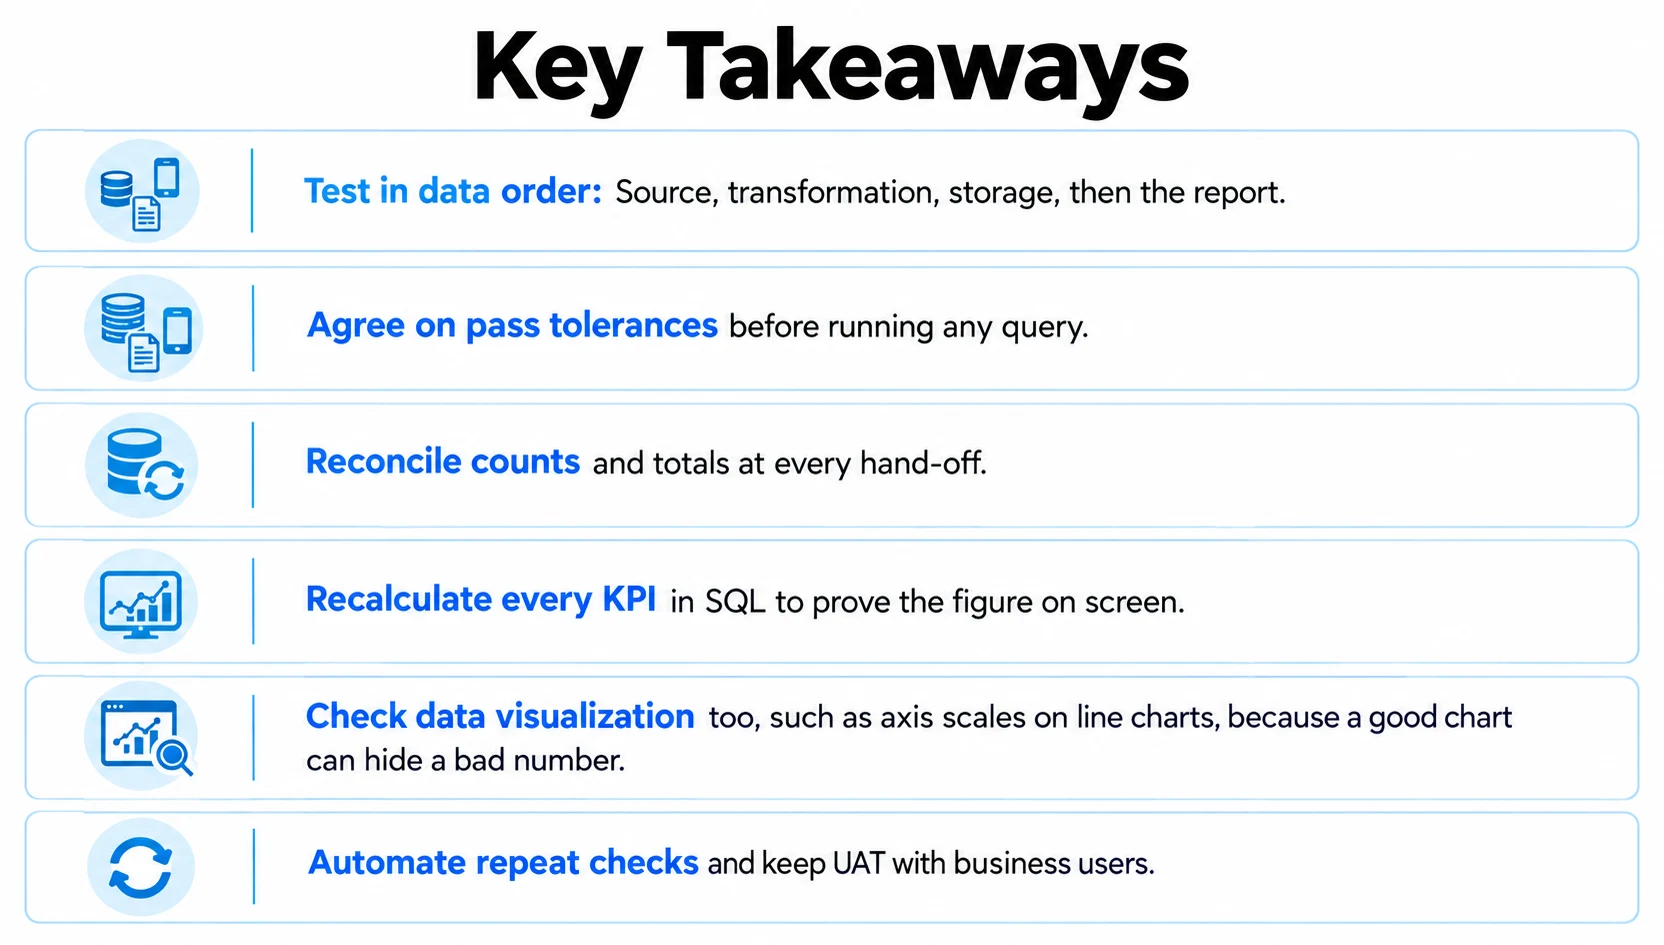
Test the source, the transformation, the load, and the report, in that order. Skip one and the error travels downstream, where it costs more to find. BI testing is less about tools than about deciding, early, what "correct" means for every number your business relies on.
Write that definition down before the next release, agree tolerances with finance and product, and reconcile at every hand-off. Then automate what repeats, keep UAT with the people who use the numbers, and let small checks run often rather than one big audit.
People Also Ask (FAQs)
Q1. How often should you retest BI reports?
Ans: Retest BI reports after every data model change, source update, or refresh schedule change. For stable reports, run automated reconciliation daily and a full manual review each quarter.
Q2. Who should own BI testing?
Ans: BI testing works best with shared ownership. Data engineers own source, ETL, and warehouse checks, QA owns test design and regression, and business users own UAT sign-off on their numbers.
Q3. Can BI testing run inside a CI/CD pipeline?
Ans: BI testing fits CI/CD when reconciliation queries and KPI checks run after every data load or model change. The build fails when totals drift beyond the agreed tolerance.
Q4. How do you measure BI testing success?
Ans: BI testing success shows in fewer post-release defects. Track defects caught before versus after release, reconciliation pass rate per refresh, and how often users question a number.
Q5. How long does a BI testing engagement take?
Ans: A BI testing engagement takes two to three weeks for a single dashboard with a few sources. A warehouse migration with dozens of reports usually takes several months.


.webp)