Cloud environments and cloud services are inherently dynamic: instances spin up and down, services auto-scale, and configurations constantly evolve. Without centralized monitoring and a clear monitoring strategy, teams risk blind spots that lead to performance issues, security events, and unexpected cost surges. Hence, the need for professional cloud testing service is becoming more relevant now more than ever.

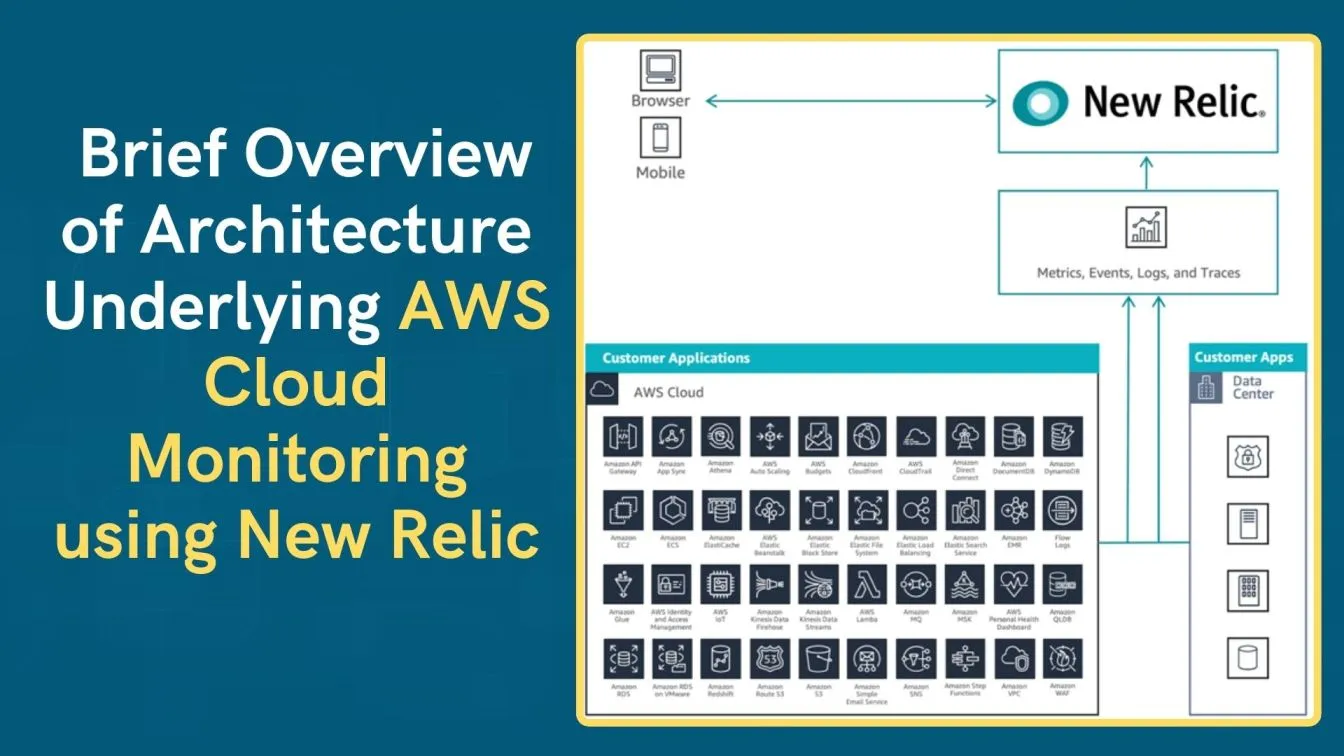
New Relic provides a single platform for cloud infrastructure observability - combining infrastructure monitoring, application performance monitoring, and security analysis - so engineers gain complete visibility into cloud resources and resource utilization across Virtual Machines, serverless workloads, and managed database services. By tracking key metrics and key performance indicators (KPIs) such as CPU usage, memory usage, error rates, resource usage, and custom metrics, you establish proactive monitoring goals that align with your business goals and regulatory requirements.
After connecting New Relic with AWS, teams enjoy real-time insights and real-time monitoring of application and infrastructure telemetry metrics, logs, events, and traces, allowing them to detect critical metrics in real time and send real-time alerts when thresholds are crossed. This seamless monitoring of a wide range of AWS services - from EC2 and RDS to Lambda and S3- ensures that basic users and advanced DevOps alike can diagnose performance issues before end users notice degraded user experience or user interactions suffer.
💡Key Takeaways
📌 Understand Features and Benefits of New Relic for AWS Monitoring
📌 Step By Step Guide on How to Integrate (Amazon Web Service) AWS with New Relic
📌 Benefits and Drawback of Using New Relic for AWS Monitoring
📌 Benefits of Using New Relic’s AI Feature for Deeper and Detailed Insights
📌 Comparison of New Relic with Other Cloud Monitoring Tools
Understanding New Relic: Features and Benefits for AWS Monitoring
New Relic Infrastructure offers a robust feature set tailored for AWS observability and performance optimization, including:

- AWS CloudWatch Metric Streams Integration: Ingest all native CloudWatch metrics—across built-in and custom namespaces—directly into New Relic for unified analysis of detailed metrics and security-related metrics in one place.
- Infrastructure Agent & CloudFormation Support: Deploy a lightweight agent on EC2 Virtual Machines via CloudFormation templates or integrate seamlessly with Fargate, EKS, and Lambda to collect system-level and container metrics such as CPU utilization, memory usage, disk I/O, and network throughput for full-stack monitoring.
- IAM & Billing Integrations: Capture AWS IAM policy and role configurations over time for security analysis, ingest AWS billing metrics as custom metrics for cost tracking, and add contextual tags to align resource usage with business goals and regulatory requirements.
- Cloud Cost Intelligence: Gain real-time visibility into AWS spending patterns, analyze cost drivers, and forecast budgets to prevent budget overruns—providing actionable insights for effective monitoring and cost optimization.
- AI-Powered Monitoring: Leverage AI and machine learning for automated anomaly detection, predictive alerts that preemptively identify potential performance degradation, and intelligent root-cause analysis across a wide range of metrics and third-party tools integrations.
Step-by-Step Guide to Integrate New Relic with AWS for Effective Resource Monitoring
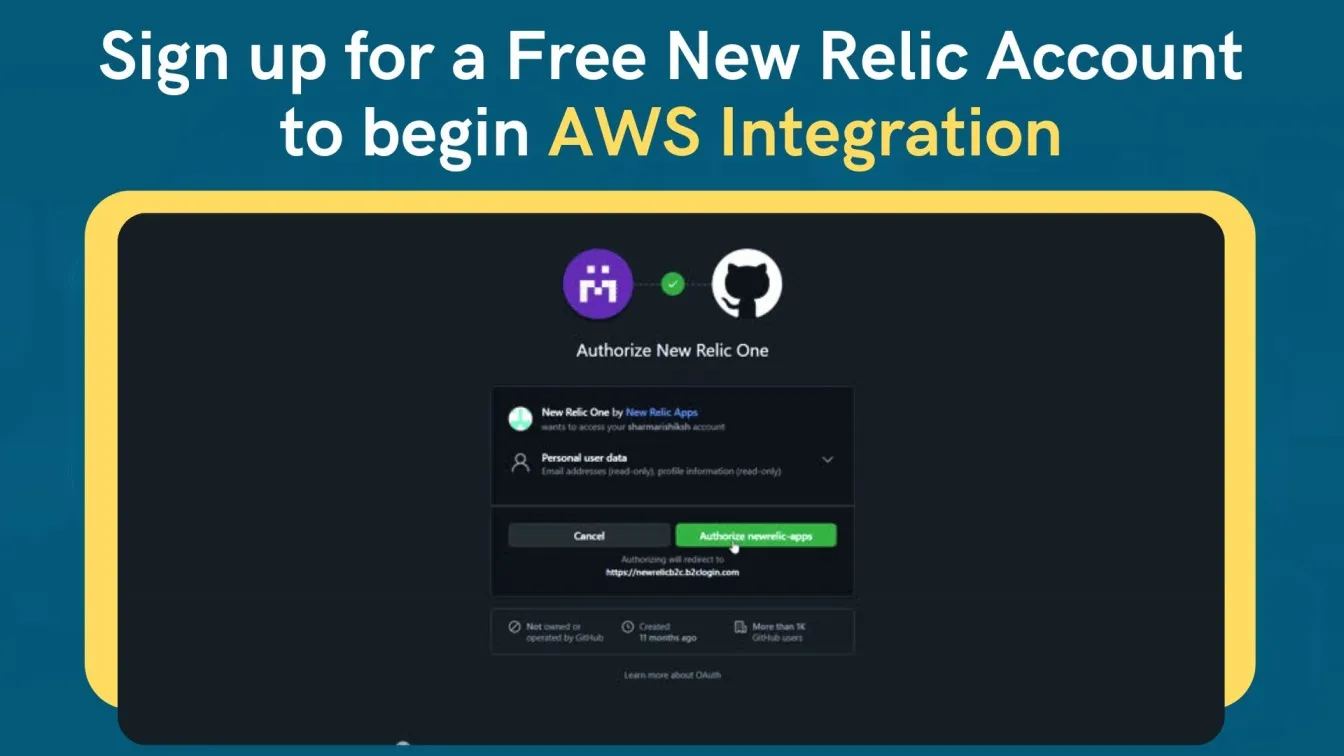
Step 1: Sign Up for a Free New Relic Account to Begin AWS Integration
Begin by creating a free New Relic account, which includes a generous 100 GB data ingest allowance per month - ideal for small-to-medium environments or trial deployments. During signup, you’ll receive a New Relic license key required for agent and API configurations. This quick onboarding helps basic users start proactive monitoring immediately and explore additional features without friction.
Step 2: Create an IAM Role and Policy in AWS for Secure New Relic Access
In the AWS Management Console, navigate to the IAM service and create a new Role with these steps:
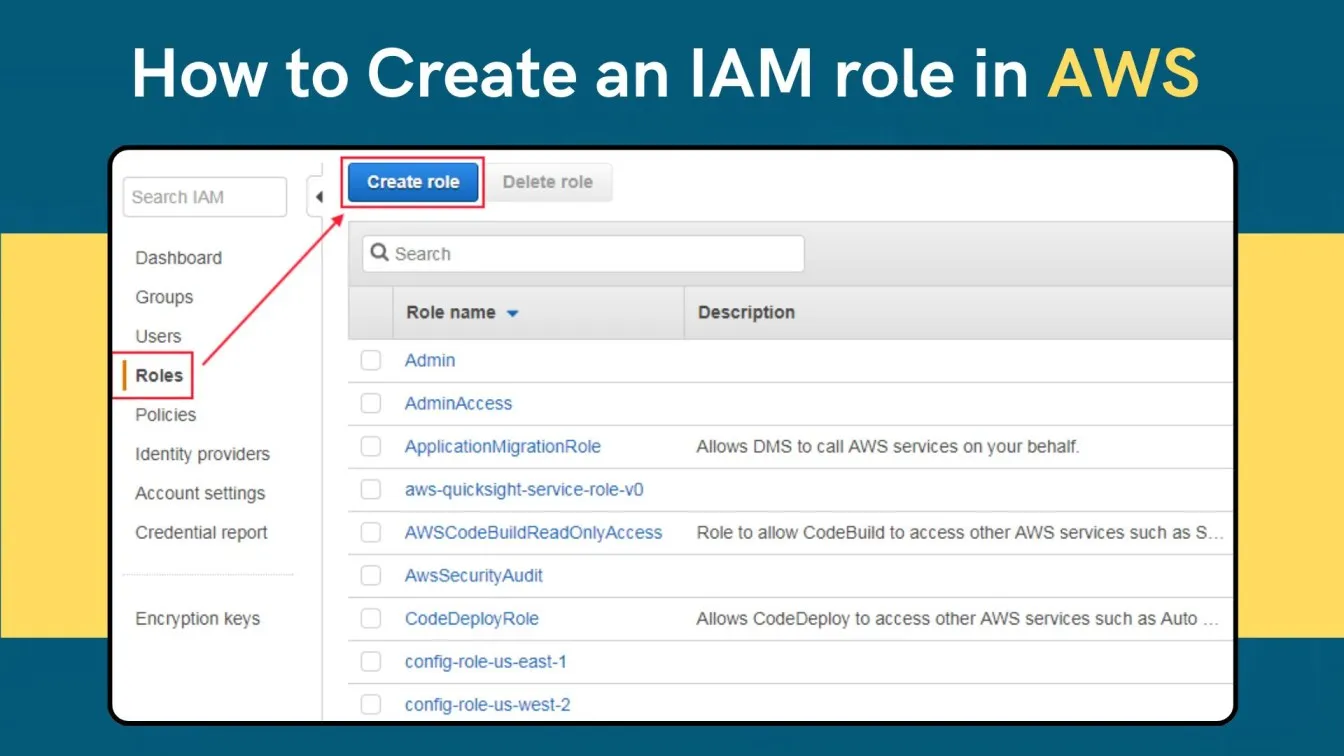
- Role Type: Select “Another AWS account” and enter the New Relic AWS account ID.
- Permissions: Attach the managed policy NR-Infrastructure-ReadOnly (or a custom policy granting cloudwatch:ListMetrics, logs:GetLogEvents, ec2:DescribeInstances, etc.) to access critical metrics like CPU usage, memory usage, network throughput, and security-related metrics.
- Trust Policy: Ensure the trust relationship allows New Relic’s principal to assume the role—upholding least-privilege and reducing security events risk.
This configuration monitoring approach ensures New Relic can read metrics, logs, and configuration data without overprovisioned permissions.
Step 3: Add IAM Role ARN and AWS Account Name in New Relic Dashboard
Back in New Relic One:
- Go to Infrastructure → AWS.
- Click Add AWS Account, then paste the IAM Role ARN and assign an intuitive AWS account alias (e.g., “Prod-Account-1”).
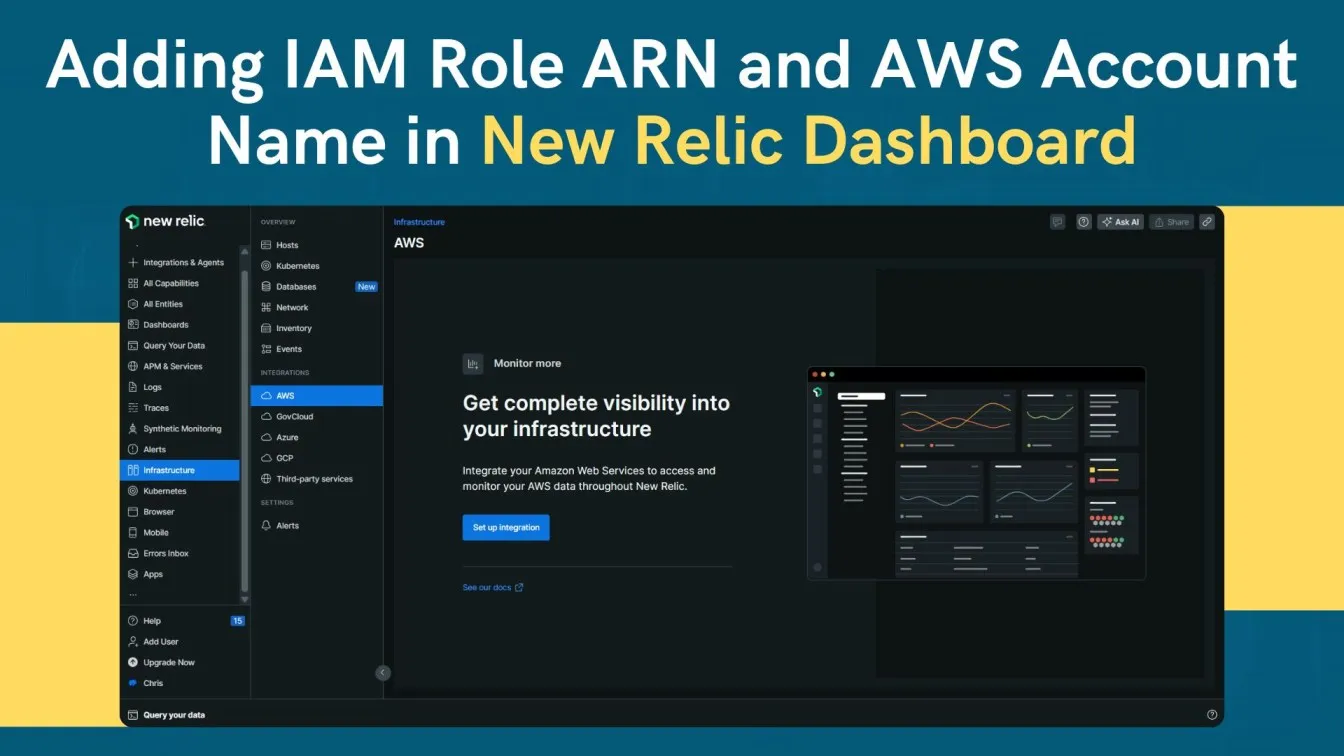
- Select the regions and services you wish to monitor, including Virtual Machines, RDS, and Lambda, then save your settings.
With this centralized monitoring setup, you unify cloud provider telemetry into one view, enabling actionable insights across all cloud resources.
Step 4: Deploy AWS CloudFormation Stack Using New Relic’s Default Template
Use New Relic’s CloudFormation template for an even quicker setup:
- Download the template from New Relic’s GitHub repo or S3 bucket.
- In AWS CloudFormation, create a new stack, upload the JSON template, and supply parameters like your New Relic license key and custom tagging for cost centers.
- Deploy the stack; it will automatically provision necessary IAM roles, policies, and the infrastructure agent.
This seamless monitoring bootstrap avoids manual configuration of each monitoring setup and accelerates time to value.
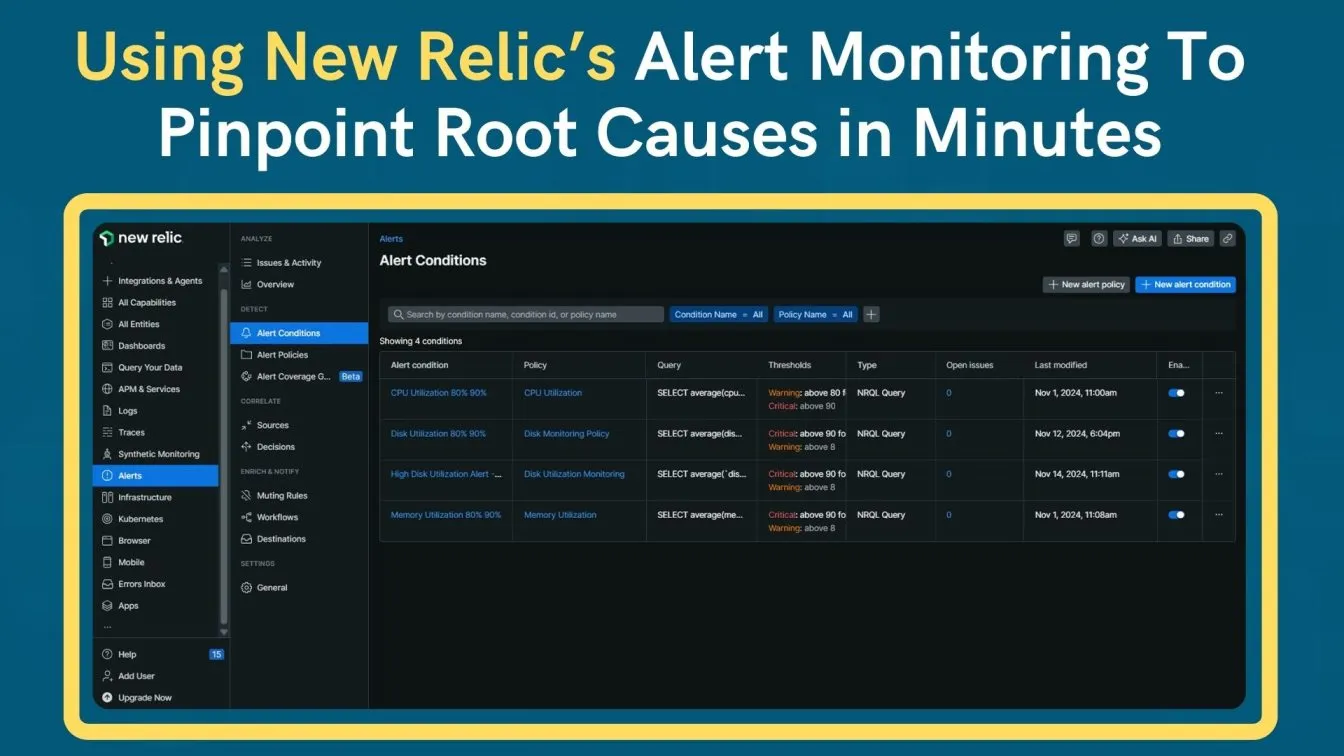
Step 5: Monitor AWS Resources in Real-Time Using New Relic’s User Interface
Once the integration is live, navigate to New Relic One → Infrastructure → AWS to view service-specific dashboards:
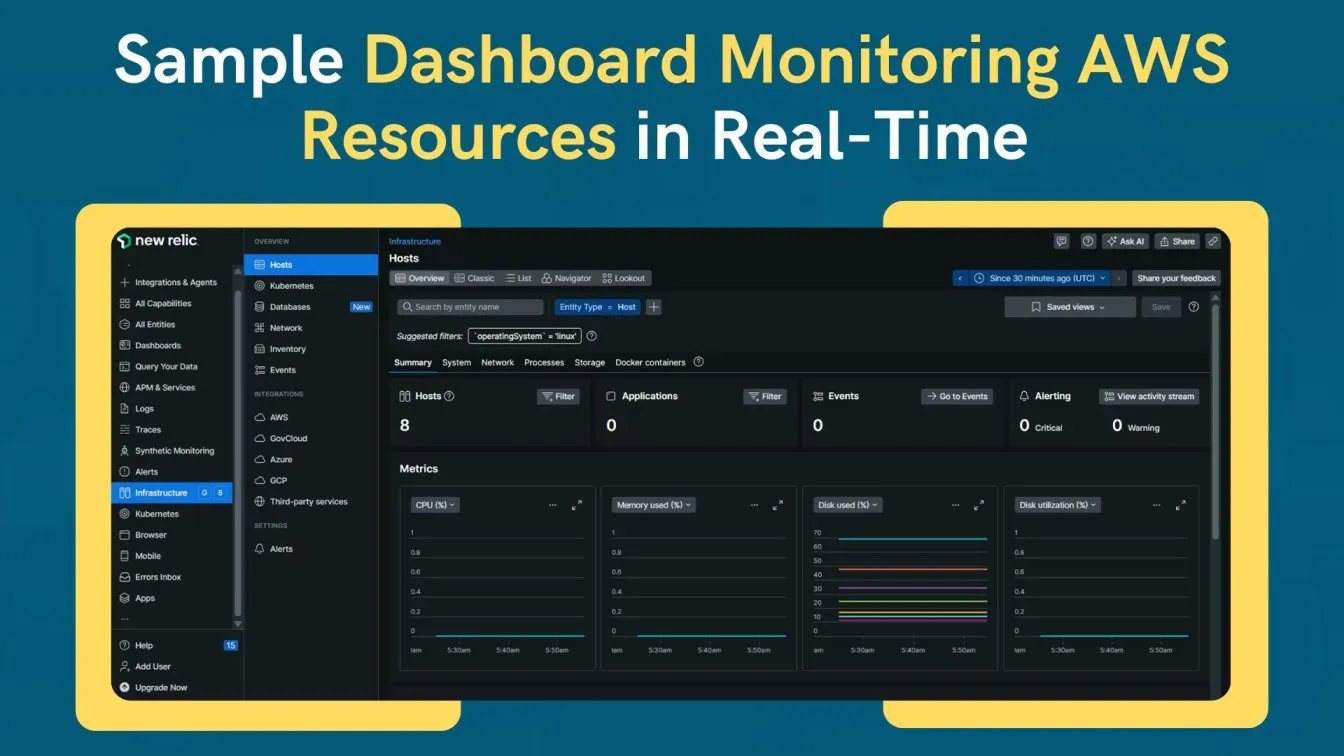
- EC2 Instances: Monitor CPU utilization, memory usage, disk I/O, and network throughput collected by the Infrastructure agent.
- Lambda Functions: Inspect invocation counts, durations, and error rates via Metric Streams to catch performance issues early.
- RDS & DynamoDB: Track resource usage, connection counts, and query latency to optimize database performance.
- Billing: Use real-time cost intelligence dashboards to visualize spend across accounts and regions.
Use flexible query builders, custom metrics, and additional features like tagging to create executive summaries or granular, per-service views. This full-stack monitoring ensures that both basic users and advanced teams can correlate user interactions with backend performance for optimal user experience.
Benefits of Monitoring AWS Resources with New Relic: Business Advantages and ROI Analysis
Monitoring AWS resources with New Relic delivers significant business value by enhancing operational efficiency, reducing costs, and improving system reliability. This brief outlines key benefits - from faster incident resolution to optimized spending and stronger security that contribute to a high ROI and streamlined cloud management.
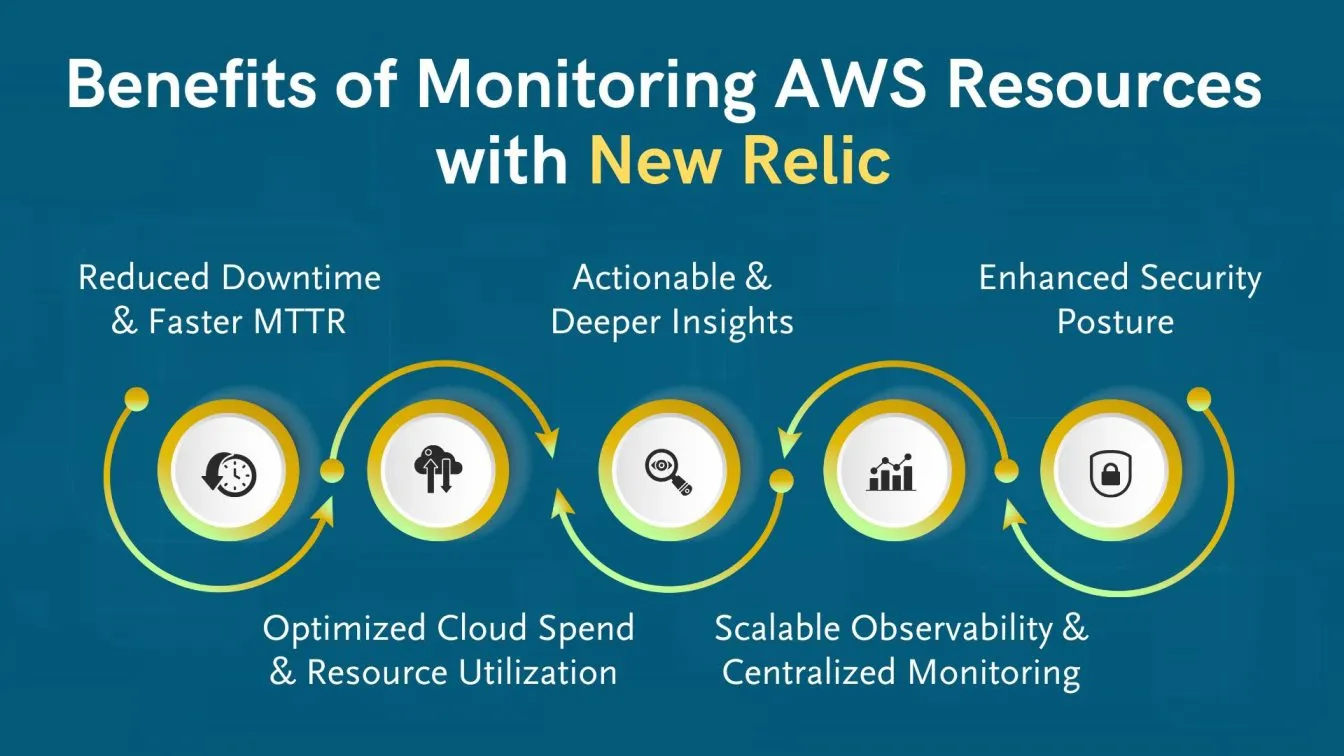
- Reduced Downtime & Faster MTTR
By correlating infrastructure monitoring and application performance monitoring data, teams pinpoint root causes in minutes, instead of hours—translating into direct savings and achieving business goals around availability.
- Optimized Cloud Spend & Resource Utilization
Real-time cost intelligence and configuration monitoring prevent budget overruns by identifying idle or overprovisioned resources, driving average cost savings of up to 20%, and aligning with regulatory requirements. - Actionable & Deeper Insights
AI-powered anomaly detection and predictive alerts generate actionable insights, giving you complete visibility into security events, performance issues, and user experience trends before they impact end users.
- Scalable Observability & Centralized Monitoring
A single integration supports hundreds of AWS accounts and thousands of resources, eliminating siloed dashboards. Full-stack monitoring across compute, storage, and network resources empowers teams to measure critical metrics in one place. - Enhanced Security Posture
Continuous monitoring of IAM configurations, security-related metrics, and security analysis workflows ensures compliance with internal policies and external regulations, while proactive monitoring catches suspicious activity early.
Potential Drawbacks of Using New Relic for AWS Resource Monitoring: Business Considerations and Cost Implications
While New Relic provides powerful monitoring for AWS environments, businesses should consider potential trade-offs. From pricing complexity to integration overhead, these factors can impact total cost of ownership, setup effort, and long-term maintainability.
- Pricing Complexity & Data Egress Costs
Tiered pricing for data ingest, user seats, data retention, and add-on features like AI monitoring can be challenging to forecast. High-volume environments may incur extra charges for exporting large datasets. - Integration Overhead
Although CloudFormation templates simplify deployment, bespoke environments may require custom IAM policies or agent configurations—adding upfront effort to your monitoring setups.
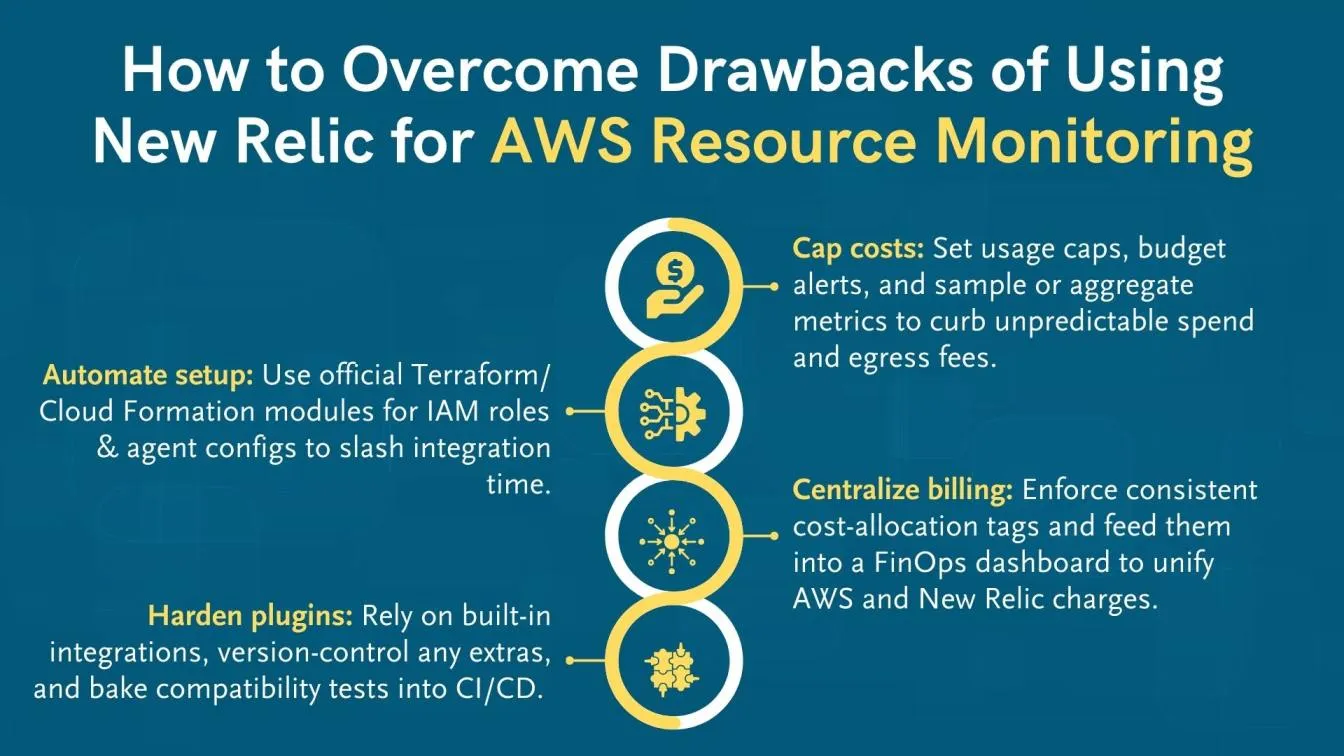
- Separate Billing Structure
While there’s no standalone fee for AWS integrations, data usage still contributes to overall New Relic charges, making it essential to track resource usage and memory usage closely. - Third-Party Tools Dependencies
Integrations with third-party tools and plugins can introduce additional maintenance overhead and potential compatibility considerations.
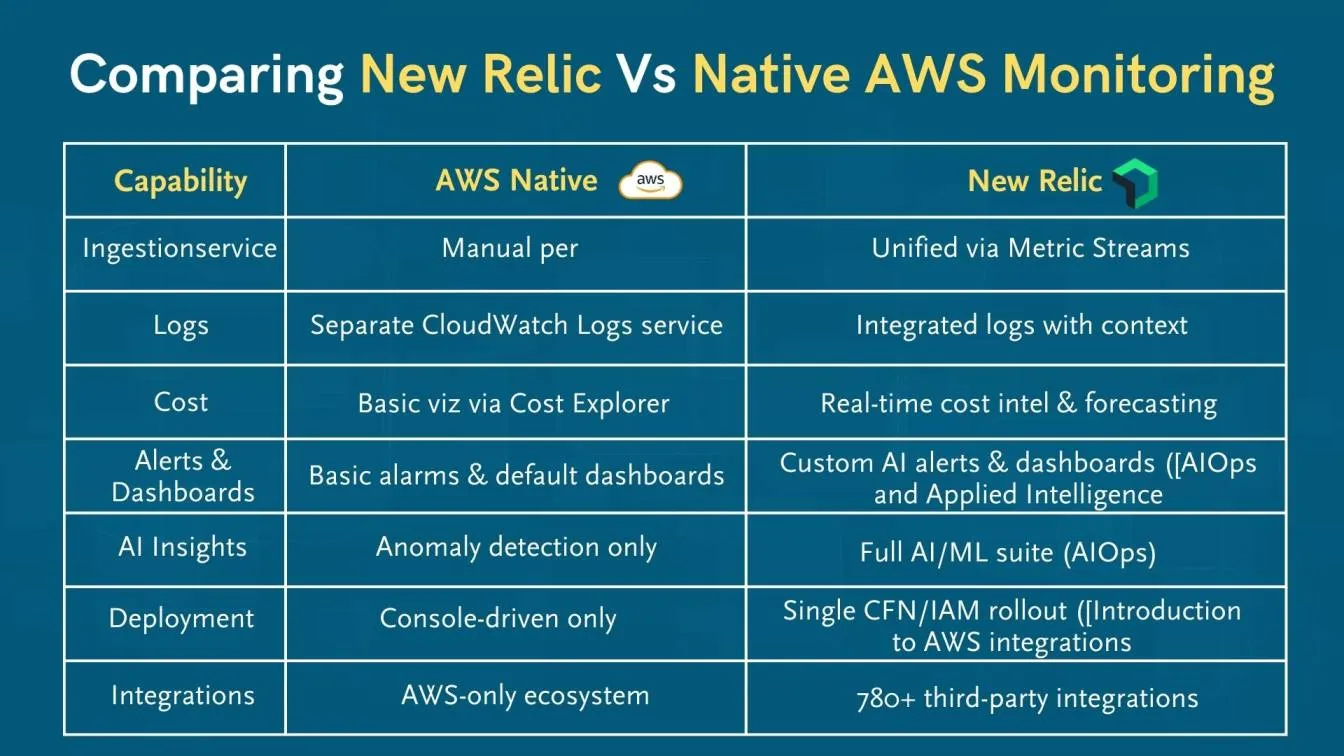
Business Comparison: New Relic vs. Other Monitoring Tools
From a business standpoint, New Relic’s usage-based pricing model delivers predictable cost alignment with actual consumption, whereas Datadog’s tiered, host-and-usage-based pricing can introduce variability for fluctuating workloads. Dynatrace and Splunk both offer volume discounts and diverse licensing options—hourly consumption for Dynatrace and hybrid host/ingest pricing for Splunk—but differ in AI-driven ROI and integration breadth.

Pricing Model
- New Relic charges on a consumption-based model—US$0.35 per GB ingested for all telemetry (metrics, events, logs, traces), with unlimited free basic users and pay-as-you-go user seats, eliminating hidden fees or penalties for overage.
- Datadog uses a tiered subscription: e.g. Infrastructure Pro at US$15 per host/month (annually) or US$18 month-to-month, with multi-year and volume discounts available.
- Dynatrace offers fully transparent hourly pricing—Full-Stack Monitoring at US$0.08/hour for an 8 GiB host and Infrastructure Monitoring at US$0.04/hour for any host size—plus no hidden fees or per-user charges.
- Splunk Observability Cloud starts at US$15 per host/month (billed annually) for Infrastructure Monitoring, with clear tiered plans and optional support upgrades.
Scalability
- New Relic scales seamlessly across hundreds of AWS accounts and thousands of agents, with “unlimited scalability” and 780 quickstart integrations pre-built for instant deployment.
- Datadog auto-instruments hosts, containers, and cloud services at enterprise scale, with multi-year discounts to support large deployments.
- Dynatrace delivers unlimited container and network process monitoring with AIOps included, supporting any host size without added configuration.
- Splunk Infrastructure Monitoring offers real-time hybrid cloud monitoring powered by a streaming analytics architecture and 200+ out-of-the-box integrations for full-stack visibility.
AI/ML Features
- New Relic embeds AI for anomaly detection, predictive alerts, and intelligent root-cause analysis via New Relic AI.
- Datadog’s Watchdog AIOps engine flags anomalies proactively and assists in automated root-cause investigation.
- Dynatrace includes Davis AI for causal AI–powered analysis, automatic dependency mapping, and security incident detection.
- Splunk uses predictive analytics dashboards to forecast degradations up to 30 minutes in advance and drive AI-driven real-time alerts.
Integrations
- New Relic supports 780+ quickstart and third-party integrations—covering AWS services, container platforms, databases, and more—for centralized monitoring.
- Datadog has surpassed 450 out-of-the-box supported integrations across cloud providers, containers, serverless, and application frameworks.
- Dynatrace offers 600+ technology integrations—AWS, Kubernetes, VMware, security tools, and community plugins—for full-stack observability.
- Splunk Infrastructure Monitoring provides 200+ pre-built integrations, OpenTelemetry data ingestion, and auto-discovery for rapid onboarding of new data sources.
ROI & Business Value
- New Relic: Forrester TEI study found a 191% ROI over three years with payback in under three months.
- Datadog: Its FinOps culture and internal “dogfooding” of products helped save over US$17.5 million annually in cloud spend.
- Dynatrace: Forrester discovered a 274% ROI over three years and a payback period under six months.
- Splunk: Forrester TEI study reports up to 243% ROI over three years, plus major reductions in outage duration and war-room cost.
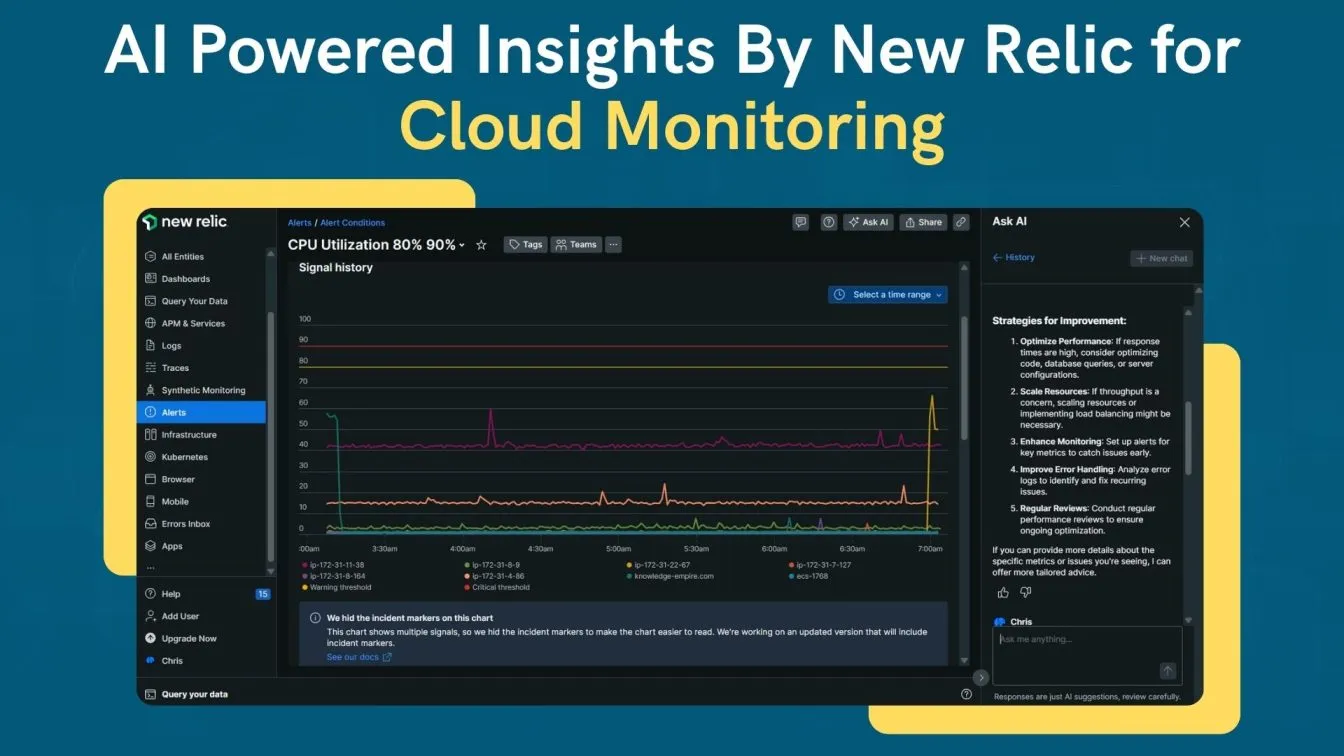
How AI Enhances New Relic Monitoring Insights for AWS Environments: Leveraging Machine Learning for Proactive Observability
New Relic’s AI Monitoring elevates AWS observability by embedding machine learning models that automatically baseline performance metrics and detect anomalies without manual configuration. Key AI-driven capabilities include:

- Automated Anomaly Detection & Predictive Alerts
Identify unusual metric patterns—such as CPU spikes, memory usage surges, or latency deviations—and receive proactive monitoring notifications before end users see any degradation. - Intelligent Root-Cause Analysis
AI-powered dependency mapping highlights service interdependencies across cloud infrastructure, speeding incident resolution and reducing MTTR. - Conversational Querying with Amazon Q Business
A custom plugin delivers a Q&A interface for querying observability data, surfacing deeper insights and actionable insights in natural language. - Integration with Amazon Bedrock
Harness generative AI to analyze security events, configuration drift, and performance optimization opportunities, augmenting traditional monitoring solutions.
Conclusion: Enhancing AWS Resource Monitoring with New Relic Integration
Integrating New Relic with AWS equips cloud engineers and business leaders with a unified, scalable, and intelligent observability solution. From straightforward CloudFormation deployments to AI-driven anomaly detection, New Relic streamlines troubleshooting, optimizes cloud spend, and bolsters compliance across complex cloud environments.
By following the outlined steps and aligning your monitoring goals with critical metrics such as CPU usage, error rates, and user experience, organizations can transform raw telemetry into actionable business value - achieving enhanced monitoring, proactive monitoring, and complete visibility across every cloud provider. Businesses could also integrate into their workflow cloud-based testing to ensure a scalable, efficient, and real-time validation of applications across diverse environments and user conditions.
People also Asked
What is the difference between cloud management and cloud governance?
Cloud management operationalizes resource provisioning and scaling; cloud governance defines policies, compliance, and cost controls across cloud resources.
What is the difference between log monitoring and SIEM?
Log monitoring focuses on performance and troubleshooting, while SIEM prioritizes real-time security event correlation, threat detection, and compliance reporting.
What are the three main areas that cloud monitoring assesses?
Cloud monitoring assesses performance (CPU, memory, I/O), availability (uptime, error rates), and security/compliance (audit trails, guardrails).
What are the 4 components of a cloud computing system?
Hardware (servers, storage), virtualization (hypervisors), network (VPC, routers), and management/software stack (APIs, orchestration, console).
What is the difference between CloudWatch and CloudTrail?
CloudWatch provides real-time operational metrics and logs; CloudTrail captures AWS API calls and user activity for audit and compliance.