
Indeed reported a 50% cut in test investigation efforts after adopting Cypress Cloud Enterprise. As one of the leading CI/CD tools, Cypress is embraced by 28% of teams alongside Jenkins (35%), underscoring its role in streamlined, continuous integration workflows. Organizations choosing Cypress often see measurable ROI through faster releases, improved test stability, and higher team productivity, thanks to its in-browser architecture and built-in debugging features.
By integrating seamlessly with modern development pipelines and providing real-time visibility into user interactions, network traffic, and application state, Cypress empowers businesses to maintain software quality, accelerate time-to-market, and scale testing across global teams - Happy testing!
💡 Key Understandings from this Blog
📌 Introduction to Cypress Test Runner.
📌 How to write your first test case using Cypress?
📌 Understanding the Cypress Architecture
📌 How to Debug Cypress Tests Quickly for Maximum Efficiency
📌 Best Practices and Tips for Optimizing Cypress Test Runner Performance
Introduction to Cypress Test Runner
Cypress is a next-generation front-end testing tool for modern web applications, built atop familiar tools like Mocha, Chai, and the Chrome DevTools Protocol. It supports cypress end to end testing, cypress component testing, cypress ui testing, and api automation testing, all within one effective test framework.
By running inside the browser (Chrome-family, Firefox, WebKit), you get direct access to the DOM, network requests, and JavaScript state-powers you won’t find in external browser automation tools like Selenium.
Installing and Setting Up Cypress Test Runner
Getting Cypress up and running takes just a few steps, making it an ideal automation testing tool to integrate into your development process quickly.
- First, install Cypress as a development dependency using your preferred package manager. This command downloads the Cypress npm module and automatically installs the Cypress binary via its postinstall script:
npm install cypress --save-dev
# or
yarn add cypress --dev- If you run into issues with the binary installation, you can execute the install step separately with debug logging to troubleshoot any postinstall errors:
DEBUG=cypress:cli* npx cypress install # Advanced troubleshooting- Next, customize your configuration file (cypress.config.js or cypress.config.ts) in the project root. This file tells Cypress where to find your spec files, how to launch browsers, and which environment settings to use:
// cypress.config.js
const { defineConfig } = require('cypress');

module.exports = defineConfig({
  e2e: {
    baseUrl: 'http://localhost:3000',
    // E2E Testing target URL
    specPattern: 'cypress/e2e/**/*.cy.{js,ts}',
    // Glob pattern for your test specs
    supportFile: 'cypress/support/e2e.js',
    // Load custom commands and setup
    setupNodeEvents(on, config) {
    // Add custom tasks or plugins here
    },
  },
});- To open the Cypress Test runner, you can type the below command
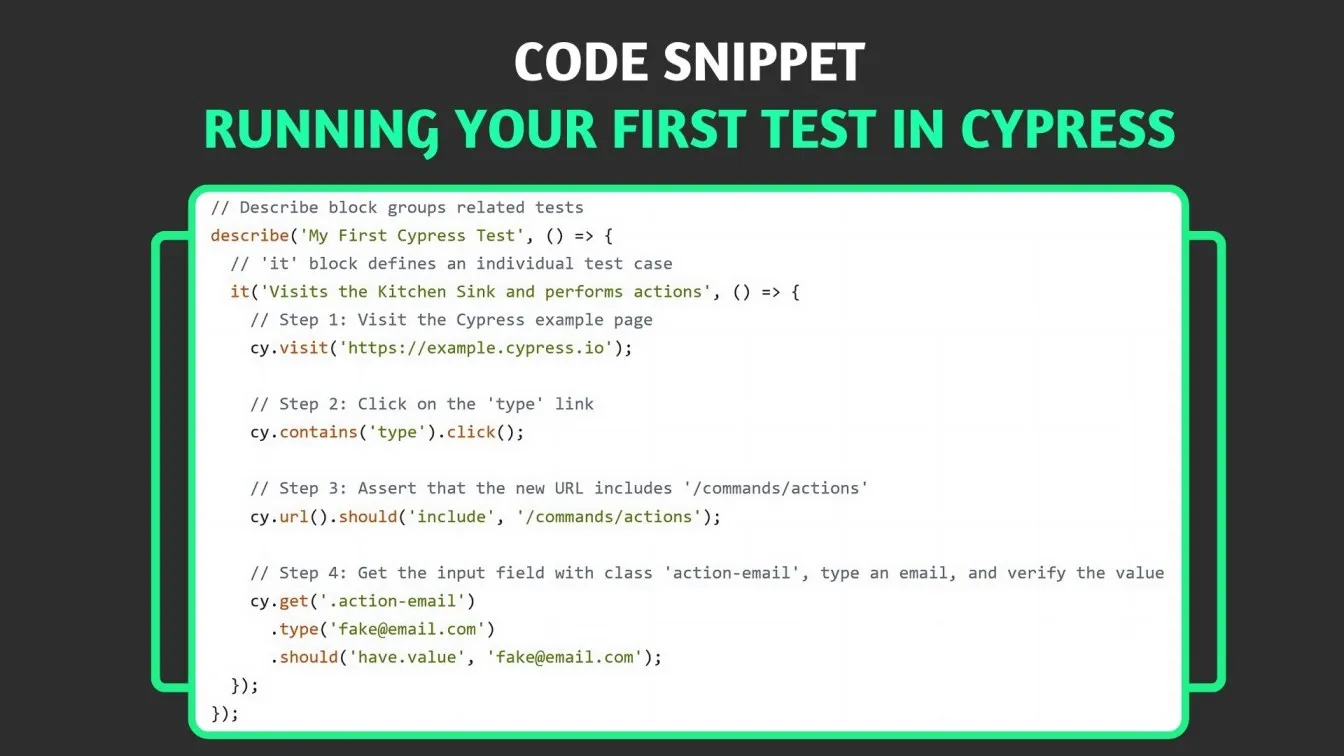
npx cypress open- Running your First Test in Cypress: Here’s a sample code to help you guide through End-to-End testing using cypress.
Understanding the Cypress Test Runner Architecture
Cypress’s unique dual‐process architecture combines a Node.js server - responsible for test orchestration, file I/O, plugin hooks, and WebSocket communication -with an in‐browser process that injects your test code directly into real browsers, giving you automatic waiting, time-travel debugging, and fine-grained network traffic control - all in a single, fast, and reliable framework.
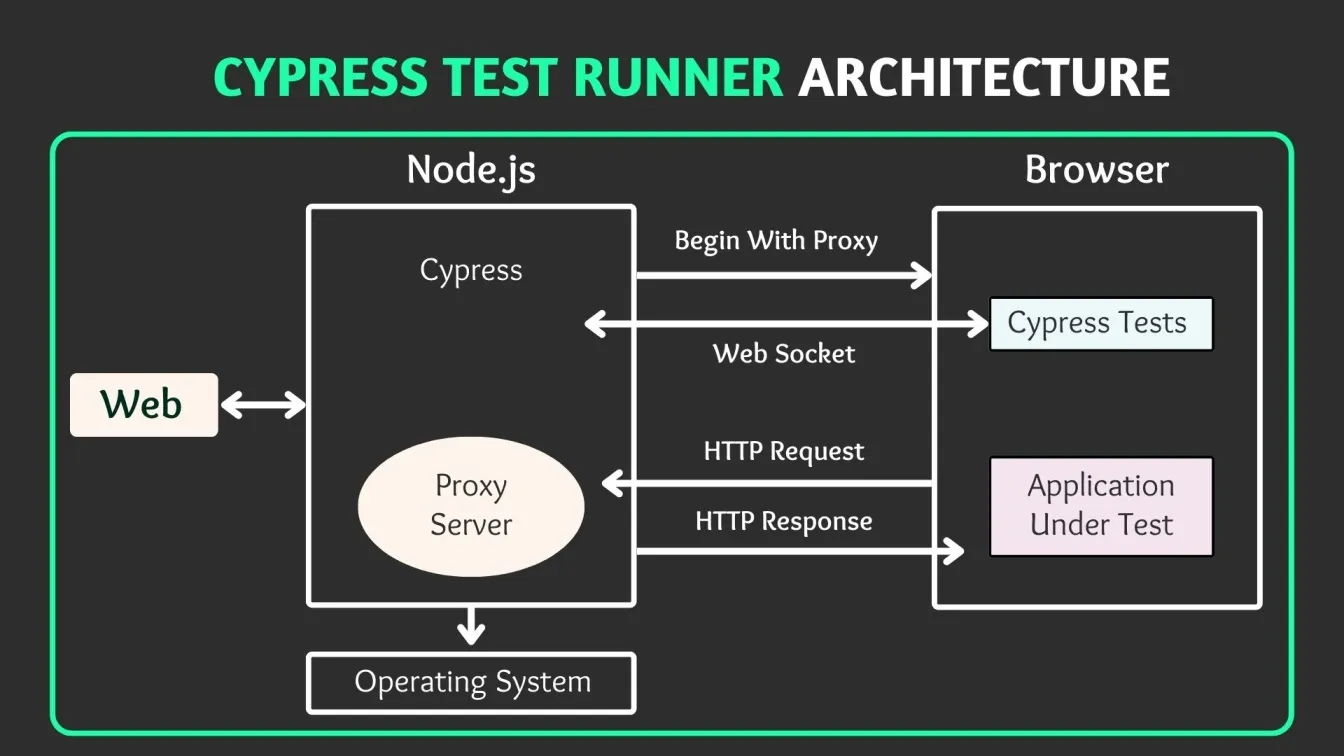
1. Node Process
- Test Orchestration & File I/O: A built-in Node server handles reading spec files, loading plugins, and managing screenshots/videos on disk.
- WebSocket Communication: It establishes a persistent WebSocket connection to the browser, sending commands (e.g., click, type) and receiving responses (DOM snapshots, network logs) in real time.
- OS Integration: Running locally allows it to leverage the operating system for tasks like video recording, capturing screenshots, and invoking external scripts, tasks that are out of reach for in-browser-only tools.
2. Browser Process
- Injected Test Code: Cypress bundles your tests and injects them alongside your application code within the browser’s JavaScript runtime, rather than driving the browser remotely.
- Real-Time Snapshots: Before and after each command, it captures the entire DOM and application state, enabling its signature time-travel feature—hovering over commands reveals exactly what the app looked like at that moment.
- Network Traffic Control: Through cy.intercept(), you gain fine-grained control over server responses, stubbing or spying on HTTP requests without leaving the browser context.
3. Dual-Process Advantages
- Automatic Waiting: By running in the same event loop as your app, Cypress automatically retries commands and assertions until they succeed or a timeout is reached - no manual sleeps needed, reducing flaky tests significantly.
- Deterministic Execution: Synchronizing Node and browser processes ensures commands execute in lockstep with application events, yielding consistent results across runs and environments.
- Real User Simulation: Tests run inside a real browser instance—complete with DevTools, extensions, and true rendering—so you’re validating exactly what your end users experience.
This split-process design makes Cypress uniquely powerful among modern web testing tools, delivering speed, reliability, and deep visibility into every aspect of your application under test.
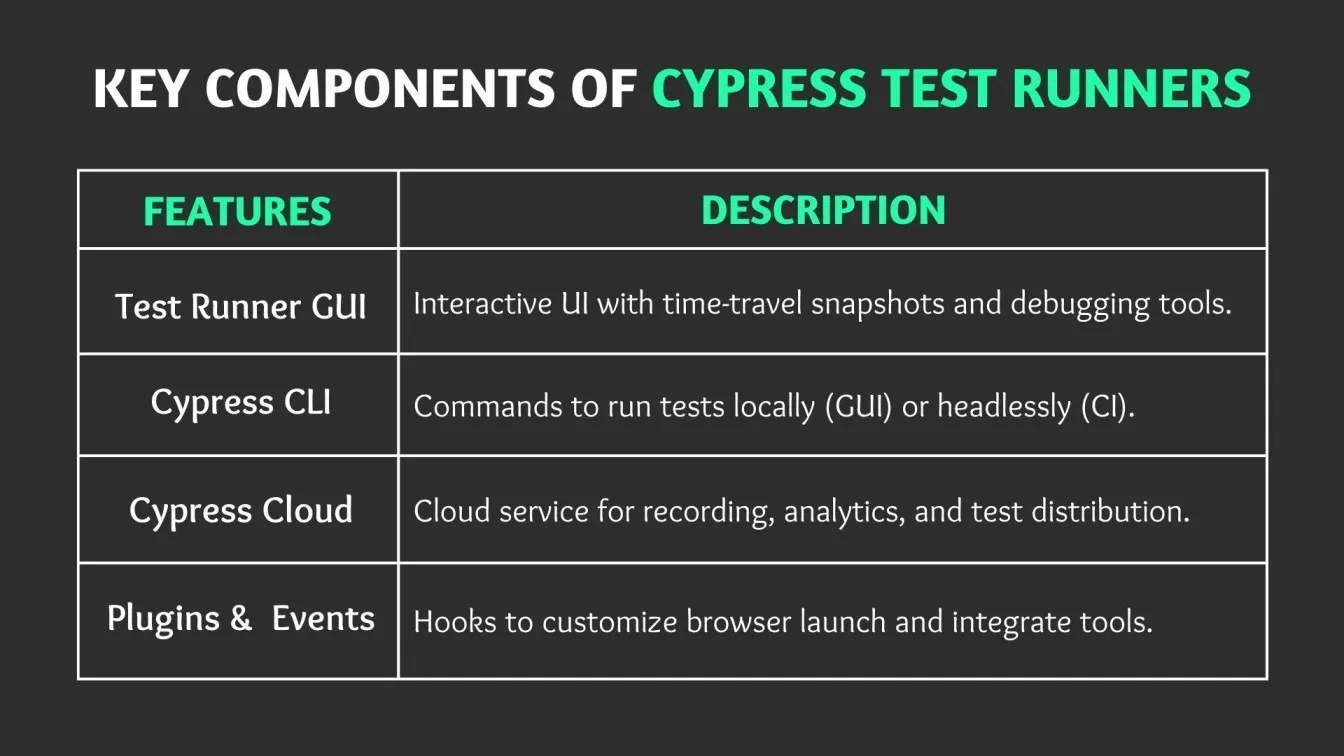
Key Components of Cypress Test Runner
Cypress Test Runner is built from four core pieces that work together to deliver fast, reliable testing for modern web apps:;lk
Configuring Cypress for Local and CI Environments
To ensure consistent and efficient testing across both local development and Continuous Integration (CI) environments, Cypress offers flexible configuration options. By defining environment-specific settings in your configuration files or via CLI flags, you can tailor your testing setup to match different stages of your development process. This approach facilitates seamless integration of Cypress into various workflows, enhancing test reliability and execution speed.
1. Define Environment-Specific Scripts in package.json
Set up custom scripts to handle different environments:
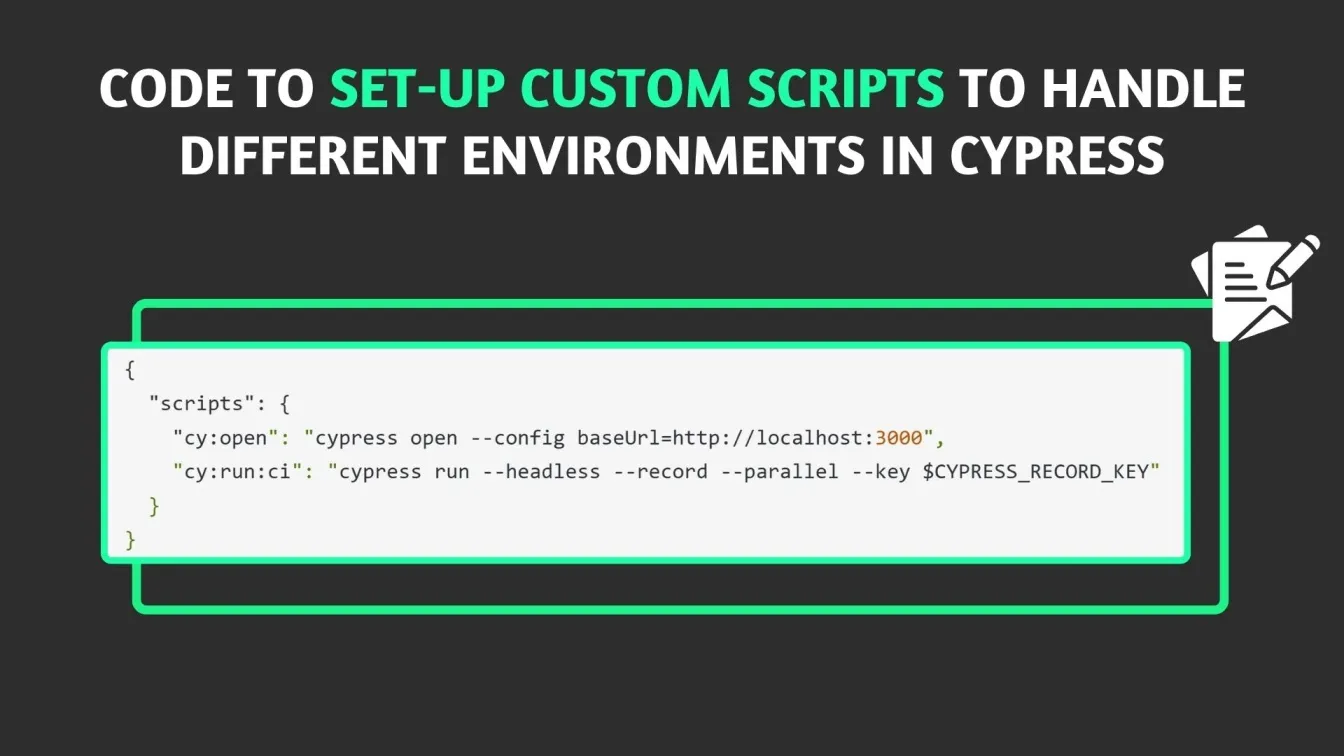
- cy:open: Launches Cypress in interactive mode with a specified baseUrl for local testing.
- cy:run:ci: Executes tests in headless mode, suitable for CI environments, enabling test recording, parallel execution, and authentication via a record key.
2. Optimize CI Setup
Implement the following steps to streamline Cypress integration in your CI pipeline:
- Cache Cypress Binary: To reduce installation time, cache the Cypress binary directory (typically ~/.cache/Cypress) across CI runs.
- Install Dependencies: Use npm ci to install project dependencies cleanly and consistently.
- Start Application Server: Ensure your application is running before executing tests. This can be achieved by starting the server in the background or using tools like start-server-and-test to manage the process.
- Run Cypress Tests: Execute the CI-specific script (npm run cy:run:ci) to run your test suite with the desired configurations.
By adopting these practices, you can achieve a robust and efficient testing workflow that adapts seamlessly between local development and various CI environments.
Running Cypress Tests: Headed vs. Headless Modes
Cypress offers two execution modes—headed for interactive debugging and headless for automated pipelines - so you can choose the best fit for your testing needs:
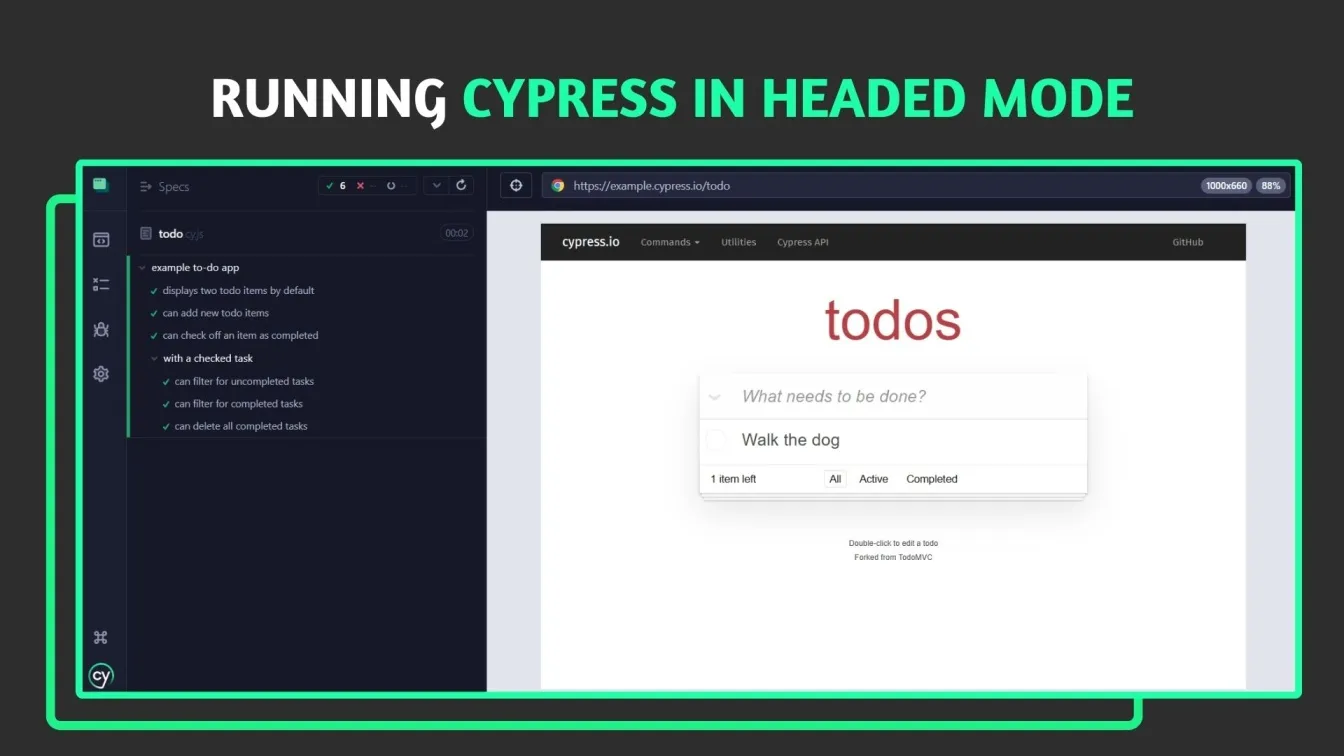
- Headed Mode (npx cypress open)
Launches the Test Runner GUI in a real browser, enabling live inspection of each test step, time-travel snapshots, and direct Developer Tools access—ideal for exploratory E2E Testing, integration tests, and unit testing of individual components.
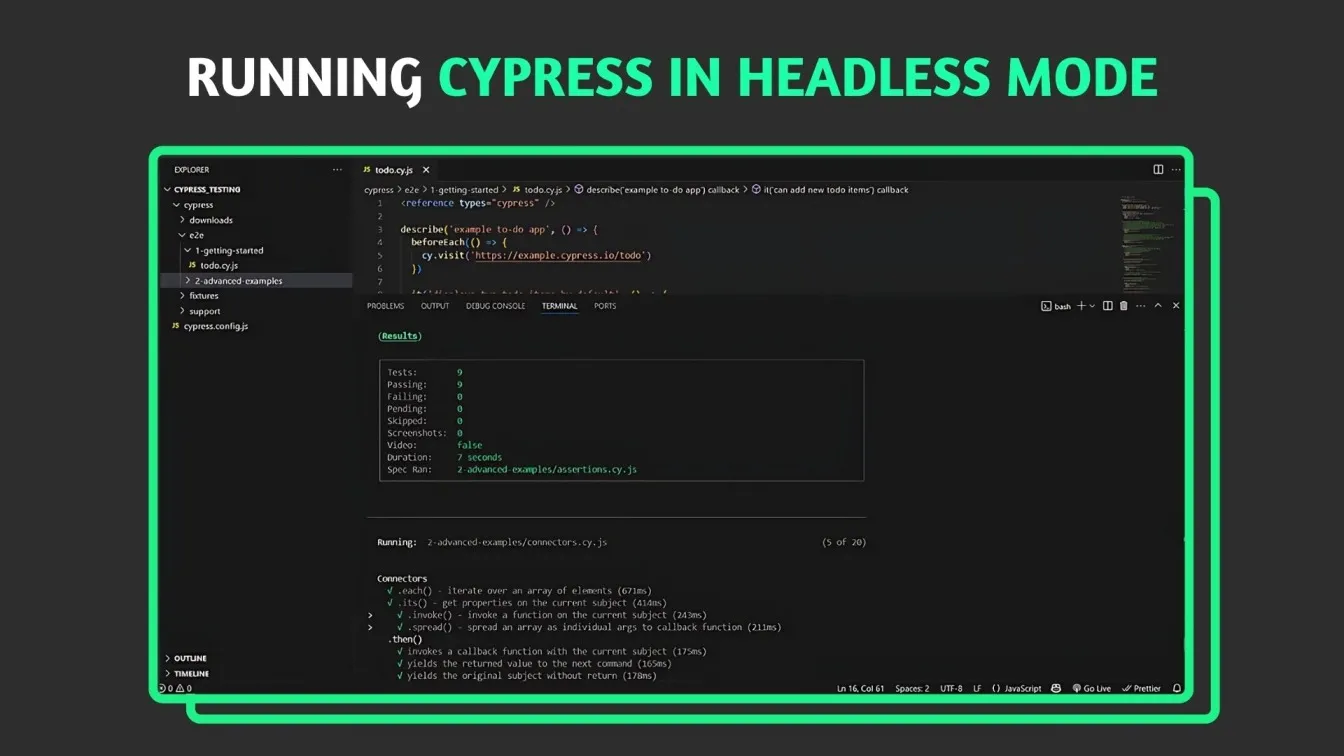
- Headless Mode (npx cypress run --headless)
Runs tests without a GUI, outputs JSON results, captures videos/screenshots, and integrates seamlessly with CI tools; its lower resource footprint and scripting suitability make it perfect for Continuous integration workflows and automation testing services.
- Specifying Browser & Version
Pin an exact browser version for consistent cross-browser testing:
This ensures reproducible environments and avoids version drift in your testing infrastructure.
Parallel Test Execution with Cypress Test Runner
Cypress Dashboard orchestrates concurrent testing across multiple CI machines. To accelerate your CI feedback loop, Cypress allows you to run tests concurrently across multiple machines:
This single command records your test results to Cypress Cloud and triggers intelligent orchestration of parallel workers.
Automatic Load Balancing
Cypress collects historical runtime data for each spec and uses it to balance work evenly across available agents. This means shorter specs run alongside longer ones, preventing “straggler” machines from delaying the overall suite.
Grouping Specs to Reduce Overhead
By grouping related spec files together—or letting Cypress automatically group them—you cut down on repeated browser start/stop cycles. Fewer startups translate to faster overall execution, especially for large test suites.
Browser Version Pinning & Docker Image Support
For true consistency across CI containers, Cypress recommends using Docker images that include specific browser versions. This avoids failures caused by unexpected browser updates in the underlying runner environment. You can choose from official cypress/browsers Docker images, ensuring every parallel node uses the exact same browser and OS stack
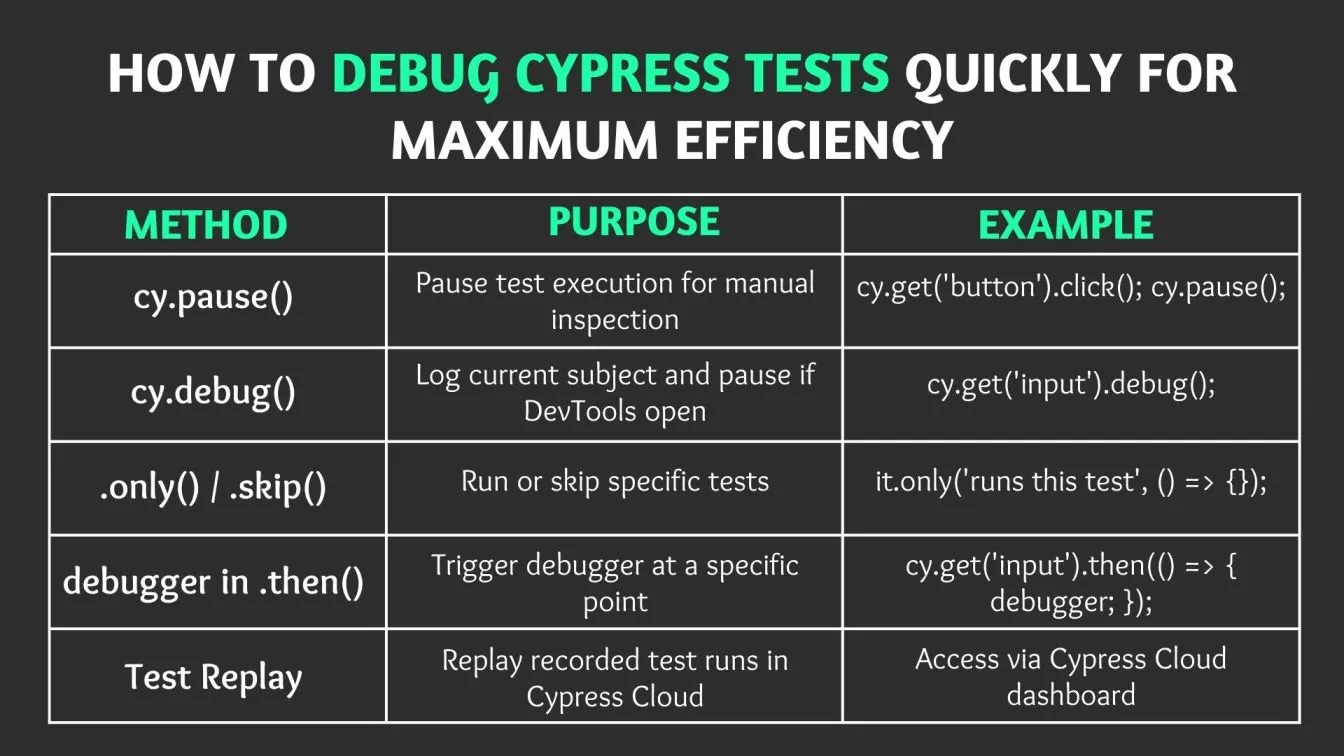
How to Debug Cypress Tests Quickly for Maximum Efficiency
Cypress offers intuitive debugging capabilities - from pausing tests mid-flight to replaying CI failures - so you can resolve issues in minutes rather than hours.
Using Cypress Command Log for Test Insights
The Command Log shows every command’s timestamps, snapshots, and network calls:
1. Interpreting Command Timestamps
Hover over commands to see start time, duration, and automatic retries—helpful for tuning defaultCommandTimeout.
2. Network Request Logging using Cypress
Stub and spy on API calls:
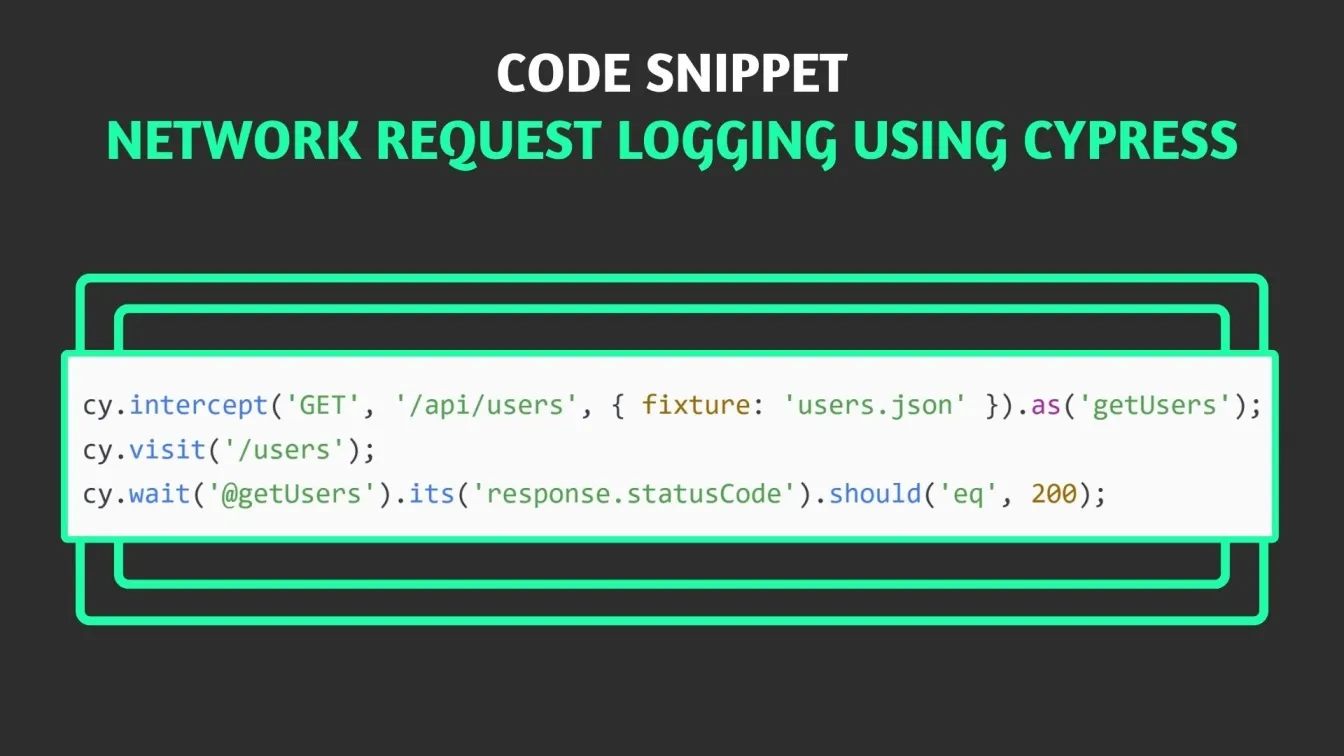
This Network Traffic Control ensures stable E2E Tests and deflakes software testing automation.
3. How to Use Cypress for DOM Snapshots and State Verification
Cypress auto-captures snapshots before/after each command; manual snapshots via .snapshot() help validate user interactions and user experience.
Leveraging Cypress Time Travel and Snapshots
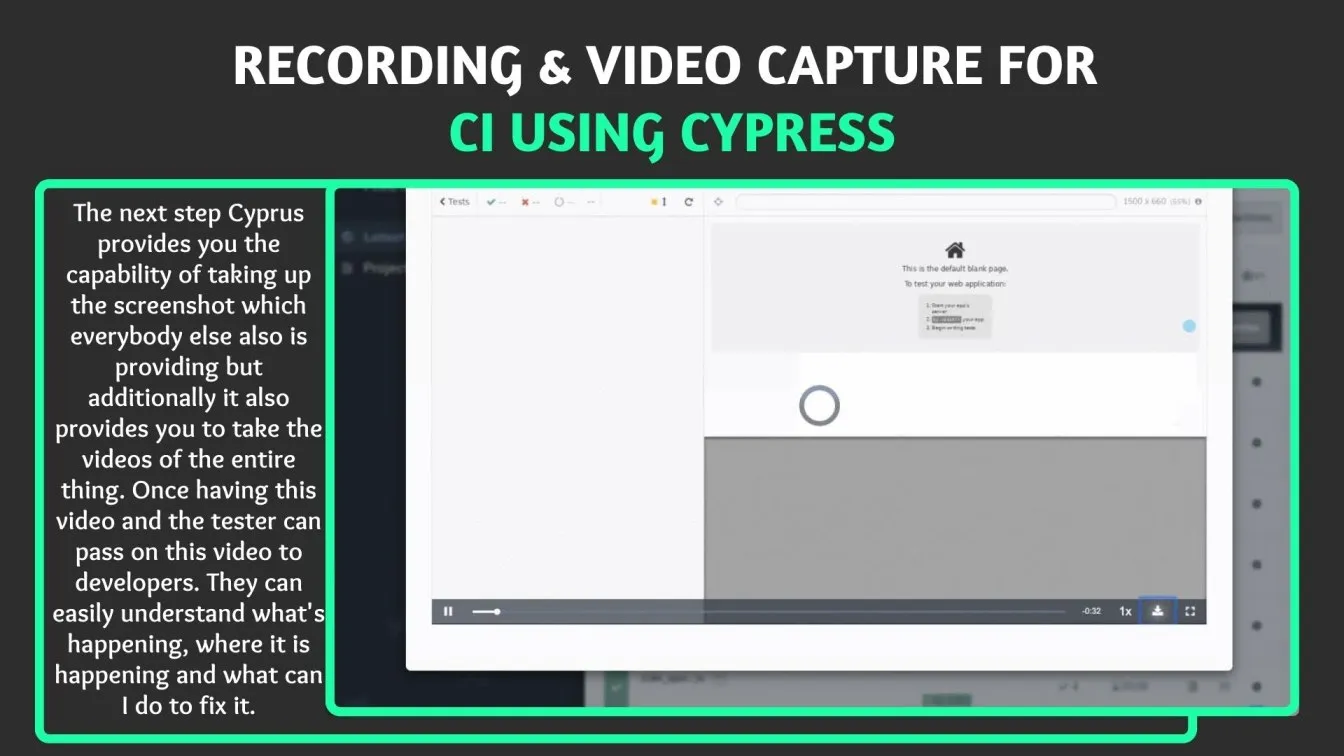
Cypress’s Time Travel and snapshot features turn every test run into an interactive debugging session, capturing the exact DOM, network, and console state at each command for pinpoint accuracy in troubleshooting. By recording runs and videos in Cypress Cloud, you can replay CI failures remotely, combining video playback with time-travel snapshots to diagnose issues without rerunning tests locally.
- Interactive Time Travel in GUI
Cypress captures snapshots before and after every command in headed mode. Hover any entry in the Command Log to see the exact application state—DOM tree, CSS, network requests, and console logs—at that moment, making it easy to trace and fix flaky tests. - Recording & Video Capture for CI
Use:
The --record flag uploads metadata, screenshots, and videos to Cypress Cloud; --video ensures full-motion recordings of each spec, preserving snapshots and logs for every step.
- Remote Debugging in Cypress Cloud
In Cypress Cloud’s Test Replay interface, select any recorded run to jump directly to the failing command, inspect time-travel snapshots alongside video playback, and review network and console data—streamlining root-cause analysis across distributed teams.
Best Practices and Tips for Optimizing Cypress Test Runner Performance
Cypress’s performance shines when you adopt a few targeted best practices that reduce flakiness, speed up execution, and scale effortlessly across local and CI environments.
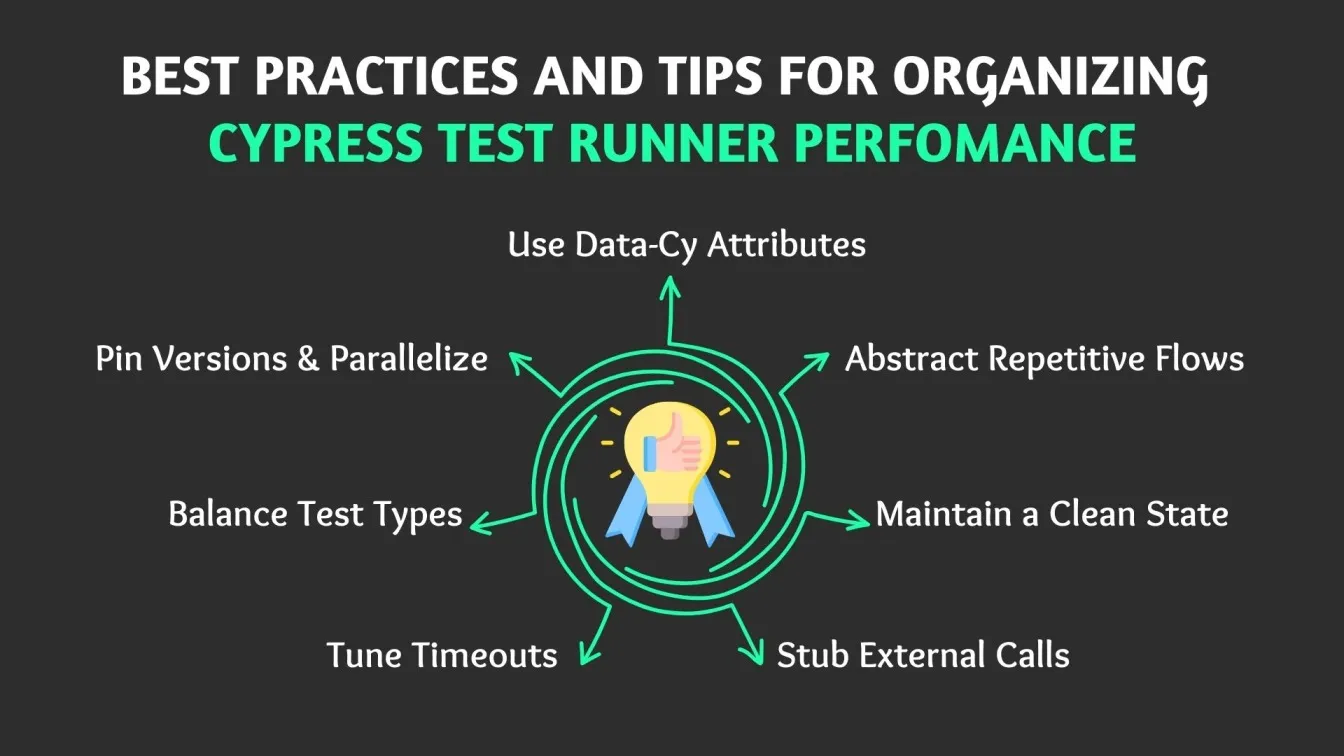
- Use Data-Cy Attributes
Target elements with data-cy selectors instead of brittle classes or IDs to simplify maintenance and speed up DOM queries. - Abstract Repetitive Flows
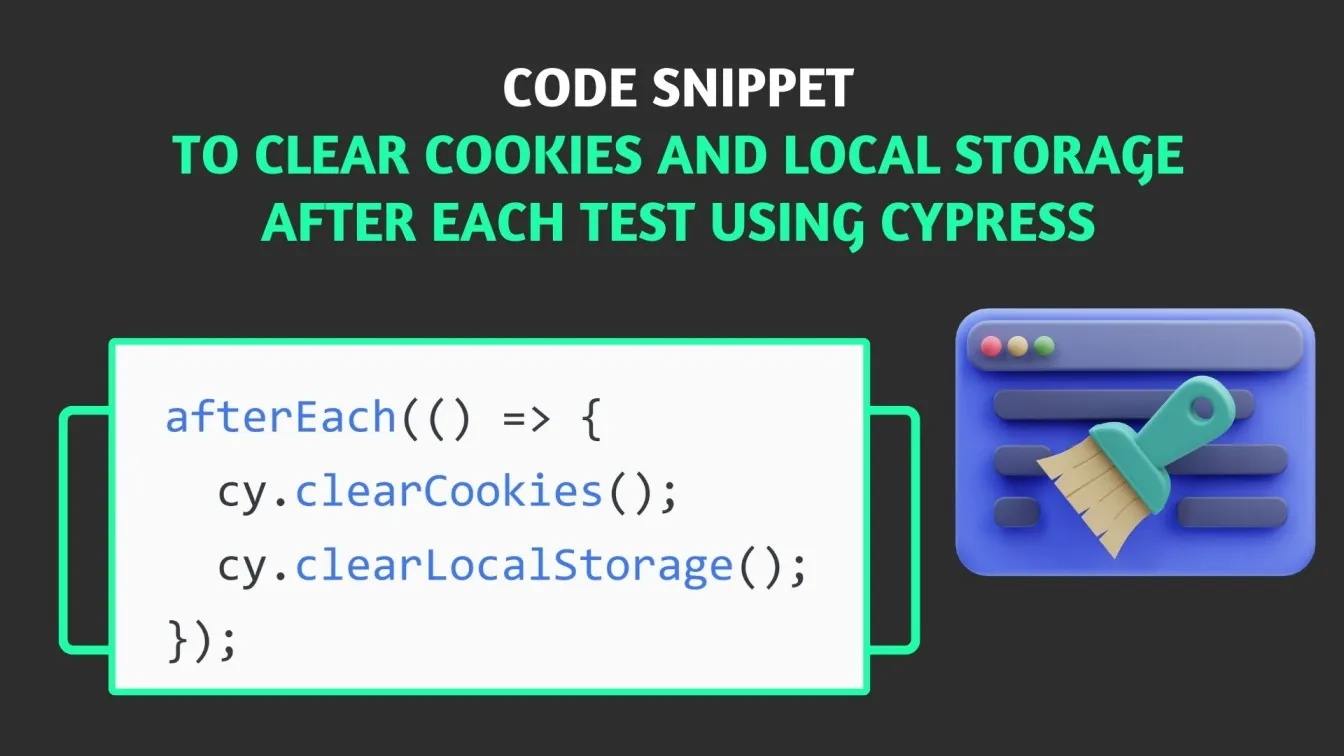
Encapsulate common actions (login, setup) in cypress/support/commands.js via Cypress.Commands.add(), reducing spec duplication and easing updates. - Maintain a Clean State
Clear cookies and local storage after each test. This avoids cross-test pollution and intermittent failures.
- Stub External Calls
Use cy.intercept() to mock third-party APIs, minimizing network variability and speeding up tests. - Tune Timeouts
Adjust command and page-load timeouts to match your app’s performance:
Prevents premature failures on slower pages.
- Balance Test Types
Use Cypress for integration and E2E tests, and offload pure business-logic to fast unit tests—optimizing overall suite runtime. - Pin Versions & Parallelize
Lock browser and Docker image versions in CI and run specs in parallel (npx cypress run --record --parallel) to cut total execution time by up to 70% .
These testing practices elevate your testing process and testing infrastructure to enterprise standards.
Wrapping it Up
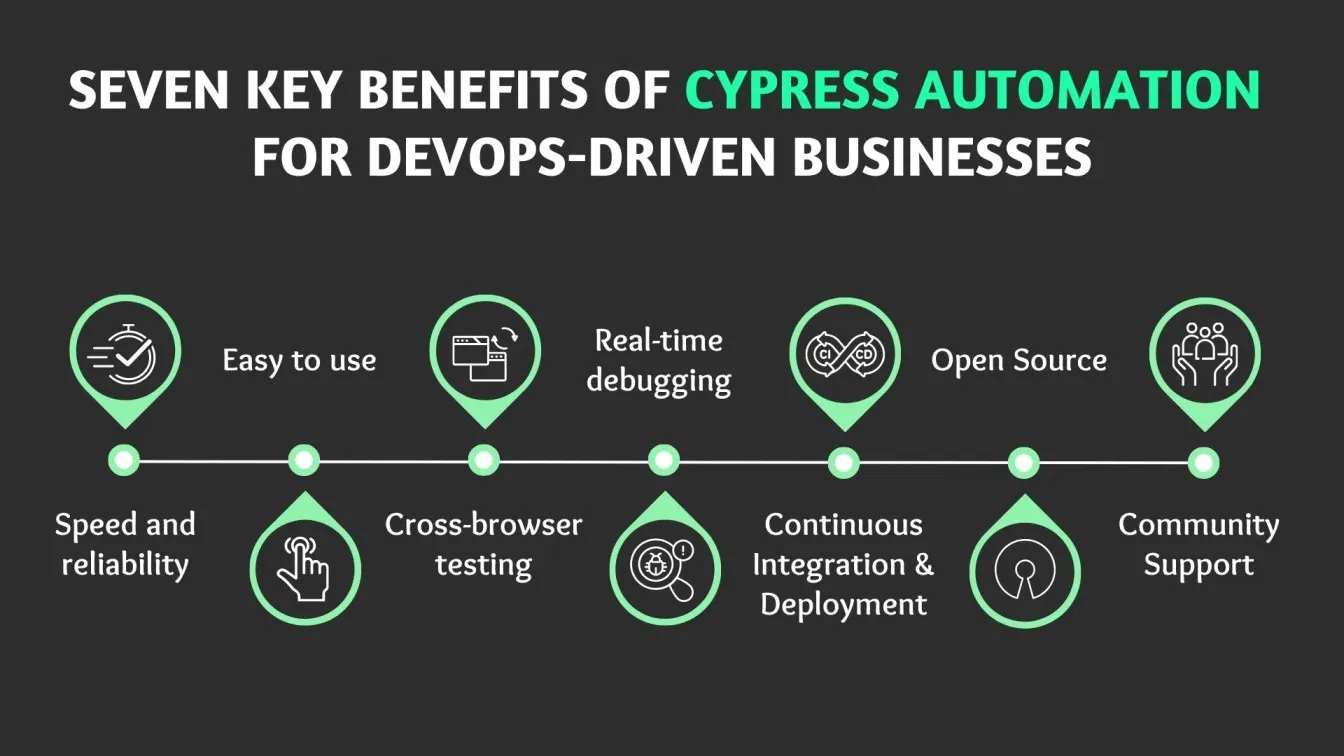
From cross-browser testing across Chrome, Firefox, and WebKit to running E2E Tests in parallel, customizing flows with custom commands, and scaling via Cypress Cloud, Cypress Test Runner delivers a unified, robust testing strategy for software quality.
Integrate with your development team’s Continuous integration tools, embrace automation testing tools list, and Happy testing!
People also Asked
What is the difference between smoke testing and QA testing?
Smoke tests quickly verify core functionality (build verification), whereas QA testing spans functional, regression, performance, and security to ensure full software quality.
What is the difference between QA testing and automation testing?
QA testing covers the full spectrum of manual and automated validation. Automation testing specifically uses tools (Cypress, Selenium) for scripted, repeatable tests.
Why use Cucumber with Cypress?
Cucumber’s Gherkin syntax enables BDD-style, human-readable tests—ideal for aligning testing scenarios with stakeholder requirements.
Is Cypress TDD or BDD?
Cypress supports both: write tests first for TDD or integrate with Cucumber for BDD. Its Mocha/Chai base is familiar tools for either approach.
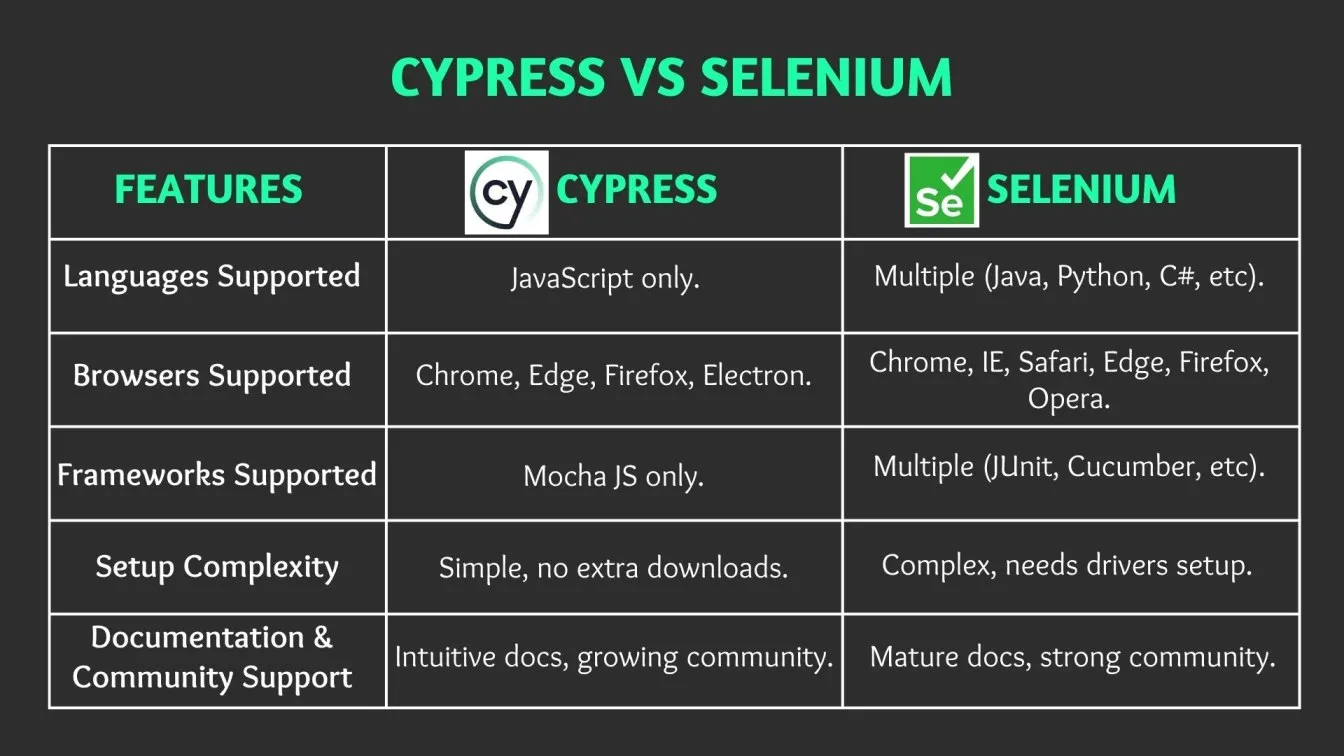
Is Cypress better than Selenium?
Cypress’s in-browser model, automatic waiting, and time travel reduce flakiness and speed debugging. Selenium offers broader language support but often at the cost of speed and reliability.