
In the dynamic world of microservices architecture, performance issues can be hard to pinpoint. This is where New Relic Distributed Tracing steps in, offering powerful visibility into how requests flow through complex cloud microservices. With New Relic APM, New Relic One, and integrated APM tools, developers can identify bottlenecks, reduce latency, and optimize service interactions.
This blog explores how to use New Relic monitoring, key New Relic features, and distributed tracing tools to enhance microservices efficiency. From New Relic dashboard insights to OpenTelemetry distributed tracing and Jaeger distributed tracing comparisons, learn how to transform your system with intelligent APM software solutions.
What’s next? Keep scrolling to find out:
🚀 Distributed Tracing Fundamentals: Understanding tracing in microservices architecture.
🚀 New Relic Setup & Integration: Step-by-step guide for microservices frameworks.
🚀 Monitoring & Performance Analysis: Using New Relic dashboards to identify bottlenecks.
🚀 Comparing Tools: New Relic vs other distributed tracing solutions.
🚀 Best Practices & Optimization: Enhancing microservices performance with New Relic tracing.
What Is New Relic Distributed Tracing and How Does It Work?
New Relic Distributed Tracing is a powerful feature within the New Relic One platform that enables developers to monitor and troubleshoot complex cloud microservices environments. It provides real-time visibility into request flows across distributed systems, helping teams identify bottlenecks and optimize service performance.
Here’s how distributed tracing in microservices works with New Relic:
- Tracks requests across multiple services and components, capturing each service’s latency and status.
- Visualizes the complete path of a transaction in a microservices architecture, highlighting where delays or errors occur.
- Integrates with OpenTelemetry distributed tracing standards for broader observability support.
- Distributed tracing is within New Relic APM, combining traces with detailed application performance monitoring metrics.
- Helps teams identify root causes faster with trace-level context directly connected to logs and metrics.
- Supports distributed tracing tools like Jaeger distributed tracing for hybrid observability setups.
- Enables quick insights through a centralized New Relic dashboard for end-to-end visibility.
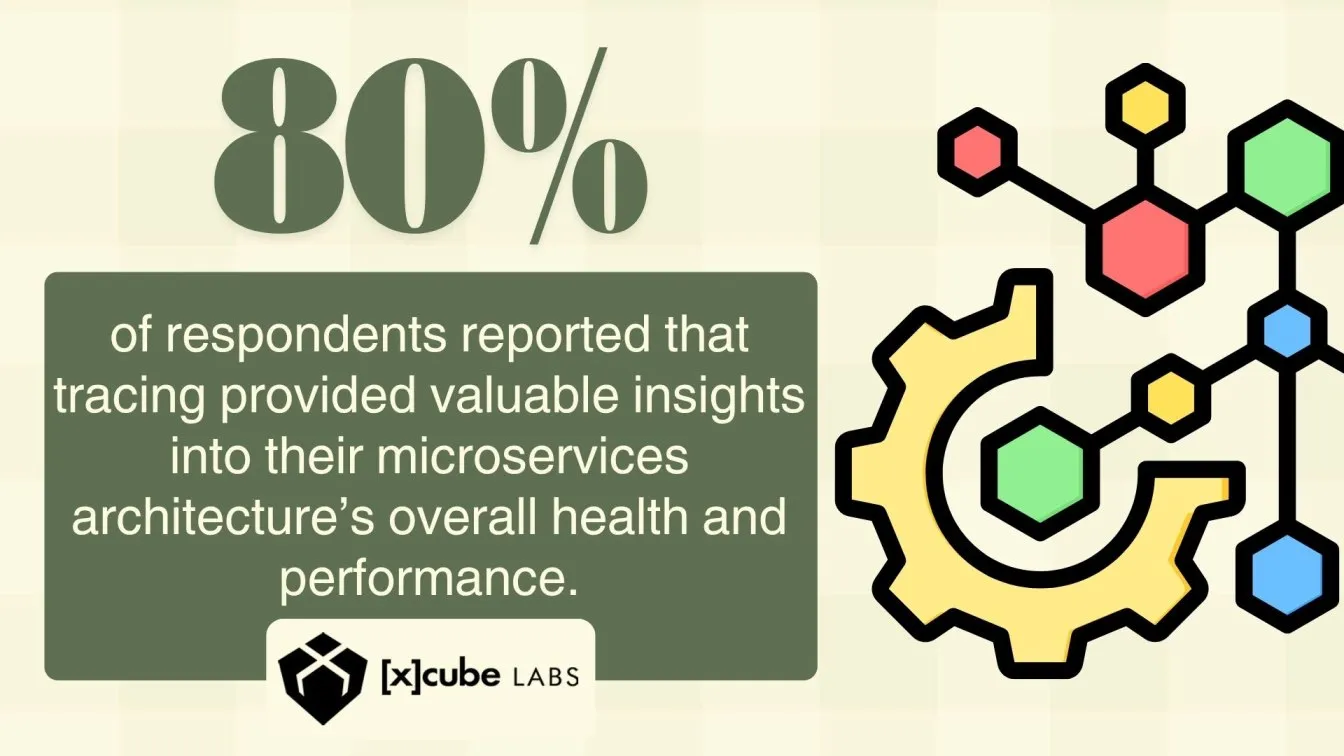
Benefits of Using Distributed Tracing in Microservices Architecture
Distributed tracing plays a vital role in optimizing microservices architecture by providing deep insights into system behavior and performance. Leveraging distributed tracing tools like New Relic allows teams to monitor complex interactions and enhance reliability.

- Enhanced Fault Detection: Distributed tracing helps pinpoint failures across cloud microservices, improving system resilience and reducing downtime.
- Detailed Request Tracking: It captures the lifecycle of requests across various services, facilitating a better understanding of service dependencies in microservices solutions.
- Optimized Resource Usage: By analyzing trace data, developers can optimize the usage of infrastructure in microservices in Java or other languages, improving efficiency.
- Improved Collaboration: Visibility provided by distributed tracing promotes cross-team collaboration during development and troubleshooting.
- Seamless Integration: Works effectively with APM tools and New Relic integration, offering a comprehensive view of application health.
- Supports Microservices Patterns: Facilitates implementation of robust microservices design patterns by revealing performance bottlenecks.
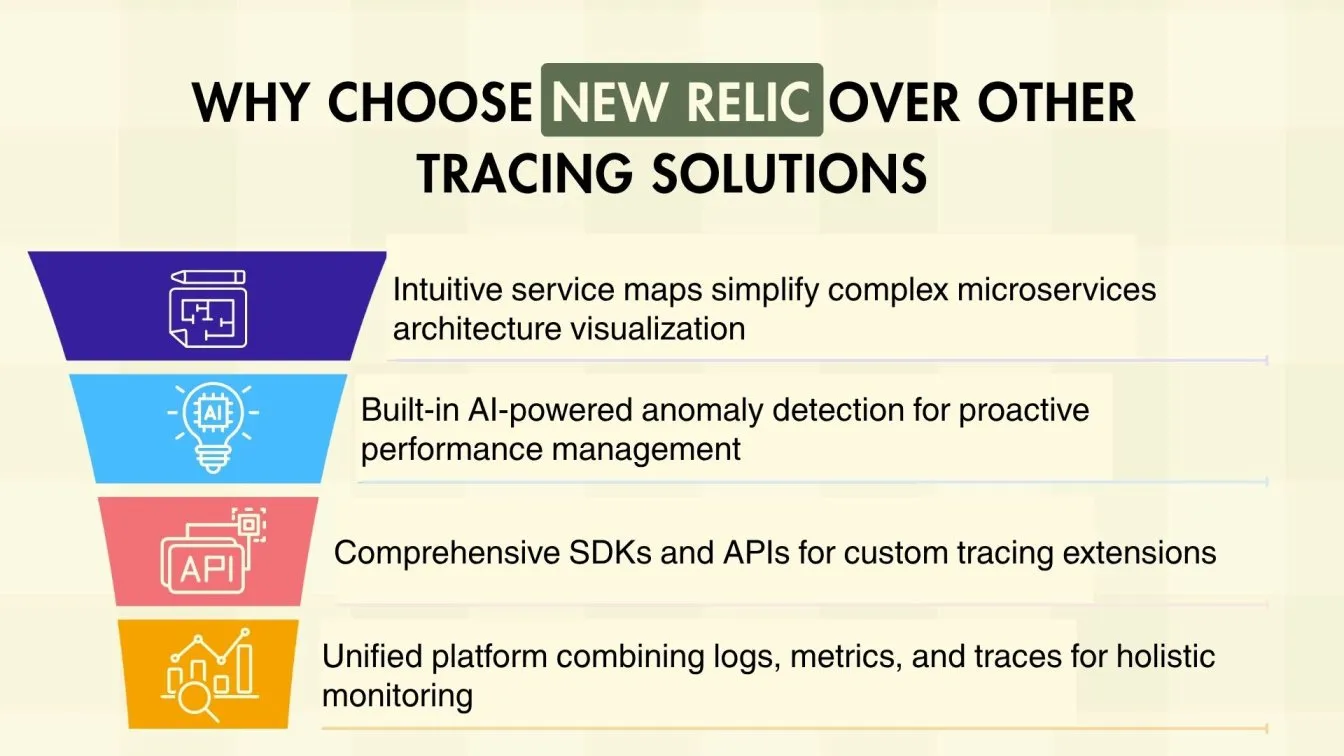
Why Choose New Relic for Microservices Monitoring?
New Relic stands out as a leading APM tool for effective monitoring and management of microservices architecture. Its comprehensive features enable developers to gain real-time insights and optimize performance across distributed systems.
- Comprehensive Dashboard: The New Relic dashboard offers an intuitive visualization of metrics, making it easier to track service health and performance.
- Seamless Integration: Supports easy New Relic integration with popular frameworks and cloud platforms, enhancing monitoring capabilities.
- Advanced Distributed Tracing: Provides powerful distributed tracing New Relic capabilities to trace requests across multiple microservices, improving debugging and root cause analysis.
- Scalable Monitoring: Designed for cloud microservices, it scales effortlessly to accommodate growing applications and complex environments.
- Real-Time Alerts: Enables proactive issue detection with customizable alerts, helping maintain optimal application performance.
- Support for Multiple Languages: Compatible with microservices in Java and other languages, ensuring broad applicability across development teams.
Setting Up Distributed Tracing with New Relic Step-by-Step
Implementing distributed tracing in microservices is essential for monitoring tools to deliver detailed insights and reduce latency issues in complex microservices environments. New Relic distributed tracing supports cloud-native and hybrid microservice architectures, helping engineering teams visualize the request across services and improve customer experience observability. Here's a step-by-step setup guide using essential New Relic features and integrations:
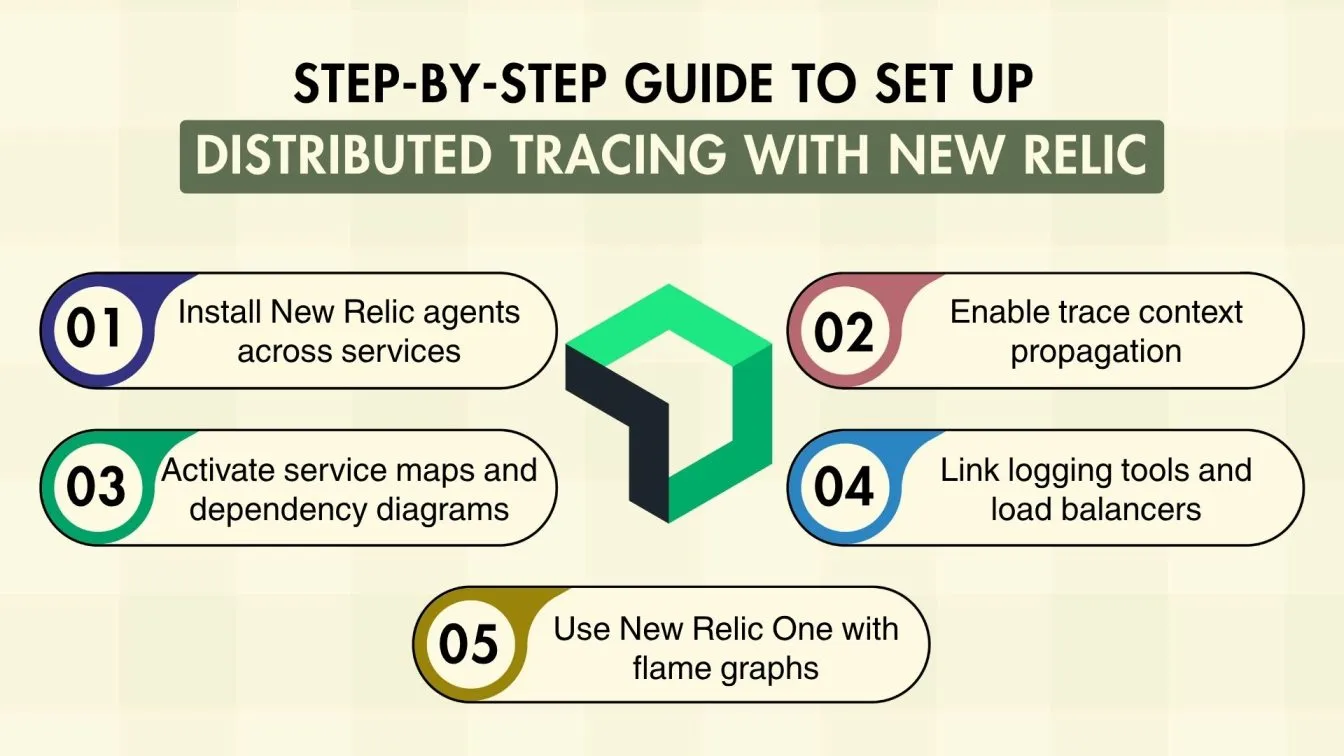
- Install New Relic agents per host: Supports New Relic software compatibility with any programming language and ensures complete visibility across your software stack.
- Enable context propagation: Tracks a single user request through multiple downstream services by maintaining request header context across the system.
- Configure service maps and dependency diagrams: Enhances New Relic dashboard to show flow of requests and interdependencies in a microservice architecture.
- Integrate logging tools and Load balancer logging: Captures error rates, network latency, and critical issues using New Relic monitoring.
- Use New Relic One and flame graphs: This combination of real-time monitoring, flame graphs, and key metrics via New Relic One efficiently optimizes performance.
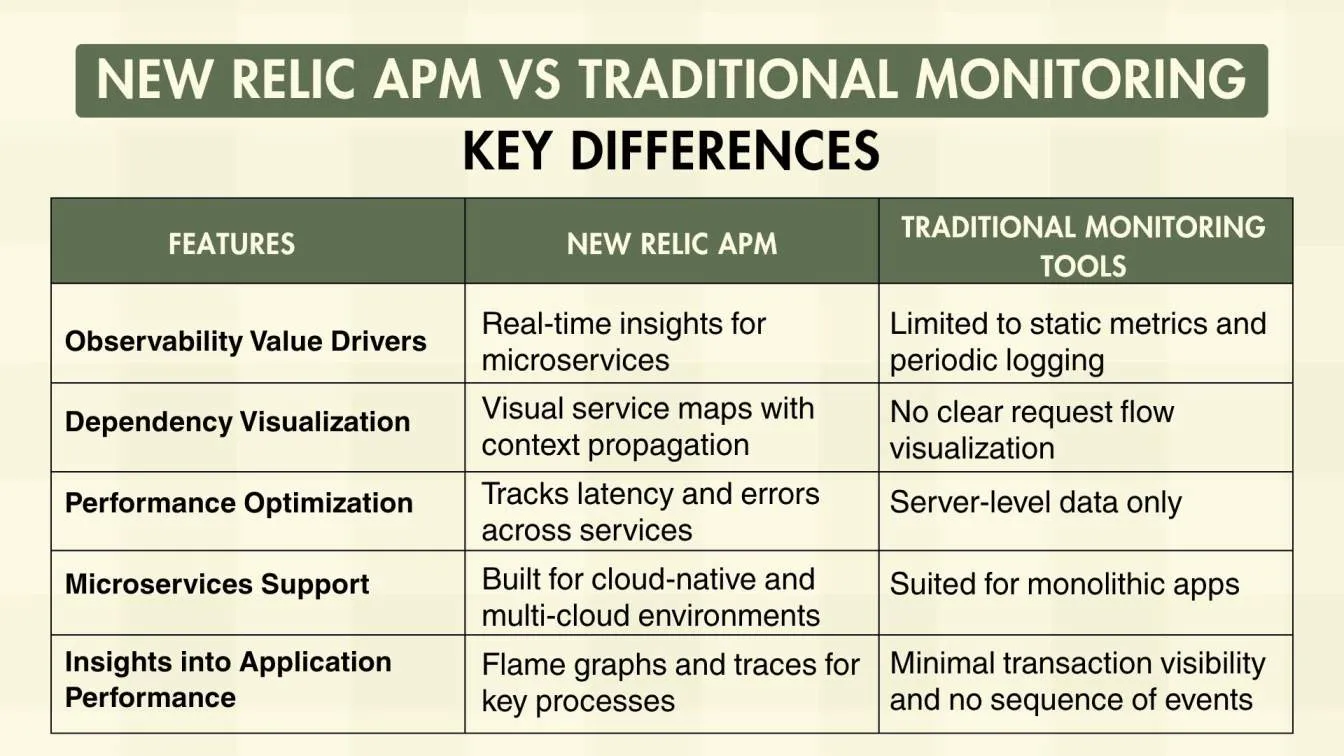
New Relic APM vs Traditional Monitoring Tools
Modern application performance monitoring, New Relic delivers deeper insights compared to traditional monitoring tools. As microservices-based distributed systems grow in complexity, New Relic APM helps engineering teams address observability objectives across the entire cloud & infrastructure stack. This comparison highlights the differences in capabilities, making it easier to evaluate performance, reliability, observability, and user satisfaction.
Integrating New Relic with Microservices Frameworks like Spring Boot and Node.js
Integrating New Relic APM with frameworks like Spring Boot and Node.js allows engineering teams to monitor individual transactions, trace origins, and identify bottlenecks in real time. With a wide range of tracing capabilities, this approach supports complex architecture scenarios by offering full trace visibility from trace context to entire trace flows, ensuring compliance requirements are met while delivering seamless user experiences across microservices.
- Spring Boot integration via Java agent: Attach the New Relic Java agent to your Spring Boot app for automatic instrumentation and detailed performance metrics.
- Node.js integration with New Relic agent: Use the New Relic Node.js agent by adding it as a dependency and configuring the newrelic.js file to start capturing telemetry data.
- Auto-instrumentation of HTTP, database, and external calls: New Relic agents automatically trace common operations in Spring Boot and Node.js, providing end-to-end visibility.
- Environment-specific configuration support: Customize New Relic settings for staging, production, or development environments to optimize monitoring and reduce noise.
- Integration with logging and telemetry tools: Combine New Relic with OpenTelemetry or logging frameworks like Log4j or Winston to enhance trace-log correlation.
Key Features of New Relic Distributed Tracing for Developers
New Relic Distributed Tracing offers a powerful tracing solution designed to help developers gain deep visibility into complex microservices environments. It enhances application performance by tracking requests across multiple services, enabling efficient debugging and optimization.
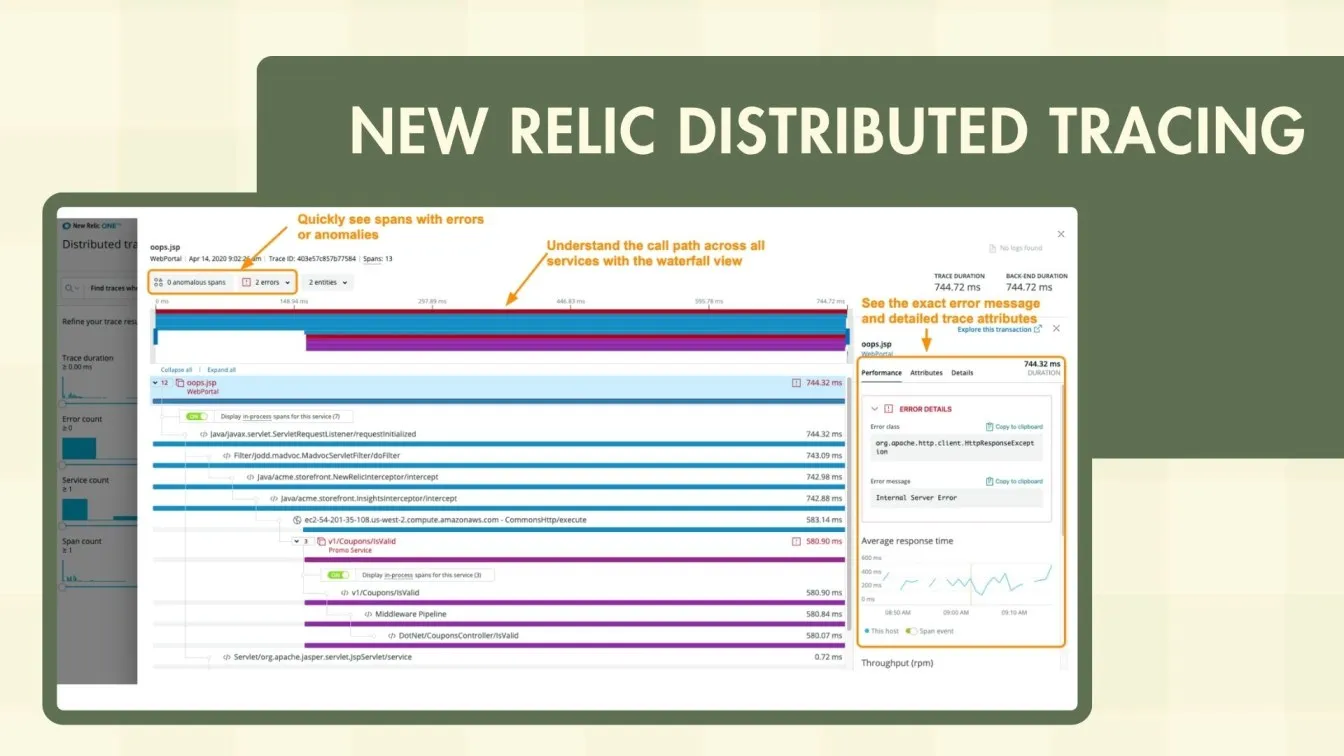
- Wide range of tracing capabilities: Captures individual traces and context propagation across services for comprehensive monitoring.
- Detailed tracing dashboard: Provides a clear view of trace origin, error paths, and sequence of events for quick issue identification.
- Drop process sample data: Allows control over data collection to reduce noise and focus on critical transactions.
- Support for multiple programming languages: Compatible with diverse microservices built using various programming languages and frameworks.
- Compliance requirements: Helps meet regulatory standards by offering trace-level visibility into transaction exceptions.
- Real-time insights: Enables developers to spot latency issues and optimize downstream services' performance promptly.
- Seamless user experiences: Facilitates smoother customer interactions by minimizing slow response times within a microservices architecture.
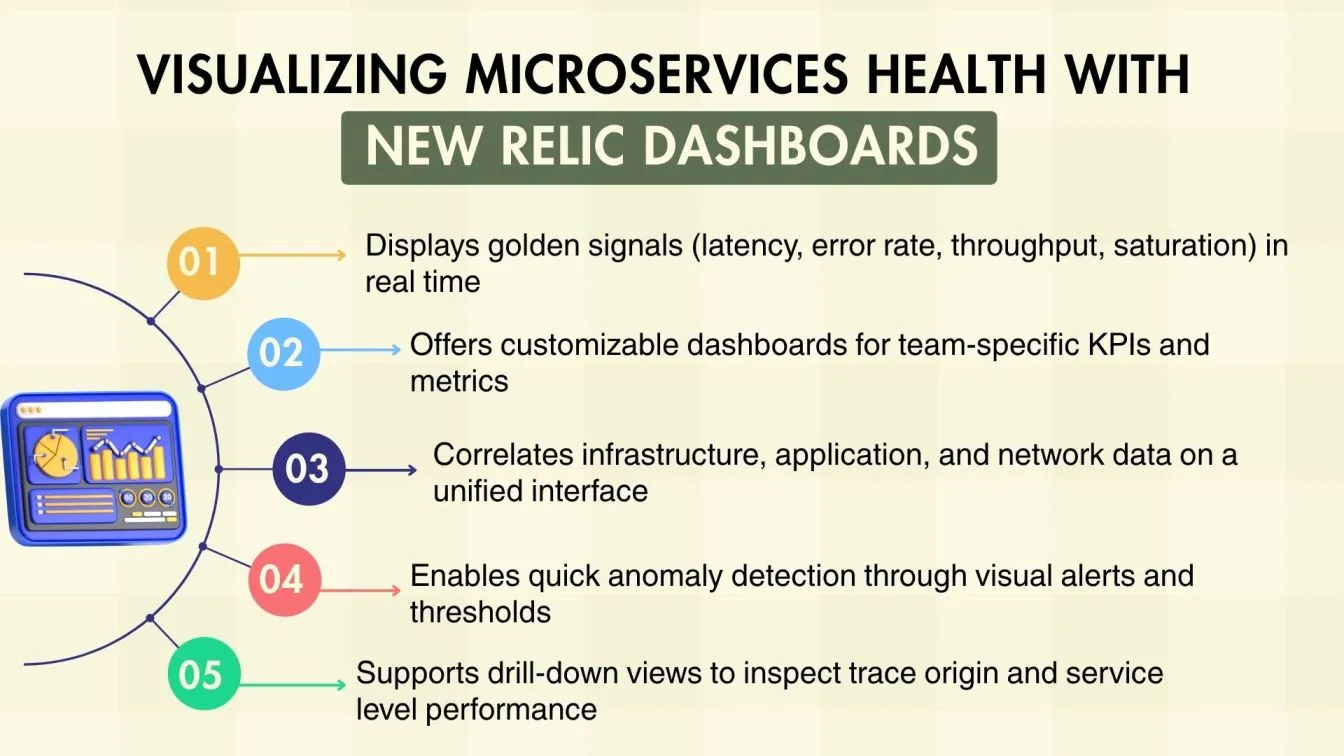
Analyzing Bottlenecks in Microservices with New Relic Dashboards
New Relic dashboards offer a robust platform for identifying and resolving bottlenecks in microservices architecture. By leveraging its application performance monitoring New Relic capabilities, engineering teams can gain full visibility into complex architectures, tracking network requests and error rates in real-time.

- Service maps and dependency diagrams: Visualize the flow of requests and pinpoint slow response times or failure points across downstream services.
- Dynamic monitoring: Tracks individual transactions and request headers to uncover bottlenecks affecting customer experience.
- Flame graphs: Help analyze CPU usage and performance optimization opportunities for better operational requirements compliance.
- Real-time alerts: Enable quick response to critical issues, ensuring seamless user experiences during peak season or high traffic.
- Integration with logging tools: Correlate logs with traces to fully understand error paths and optimize the payment microservice or other components.
New Relic vs Other Distributed Tracing Tools for Microservices
Choosing the right tracing solution is essential for ensuring visibility and performance in a microservices-based distributed system. While many tools offer tracing capabilities, New Relic stands out in terms of ease of use, integration, and detailed observability. Here’s how it compares to other distributed tracing open source and commercial options:
Common Issues in Microservices Tracing and How New Relic Solves Them
Tracing in complex microservices environments presents challenges that impact observability, performance, and scalability. New Relic addresses these concerns through its intelligent tracing solution and real-time monitoring capabilities, streamlining issue resolution and enhancing the customer experience.

- Lack of trace visibility: New Relic offers full trace context and tracks the entire trace from trace origin to completion, solving blind spots in individual traces.
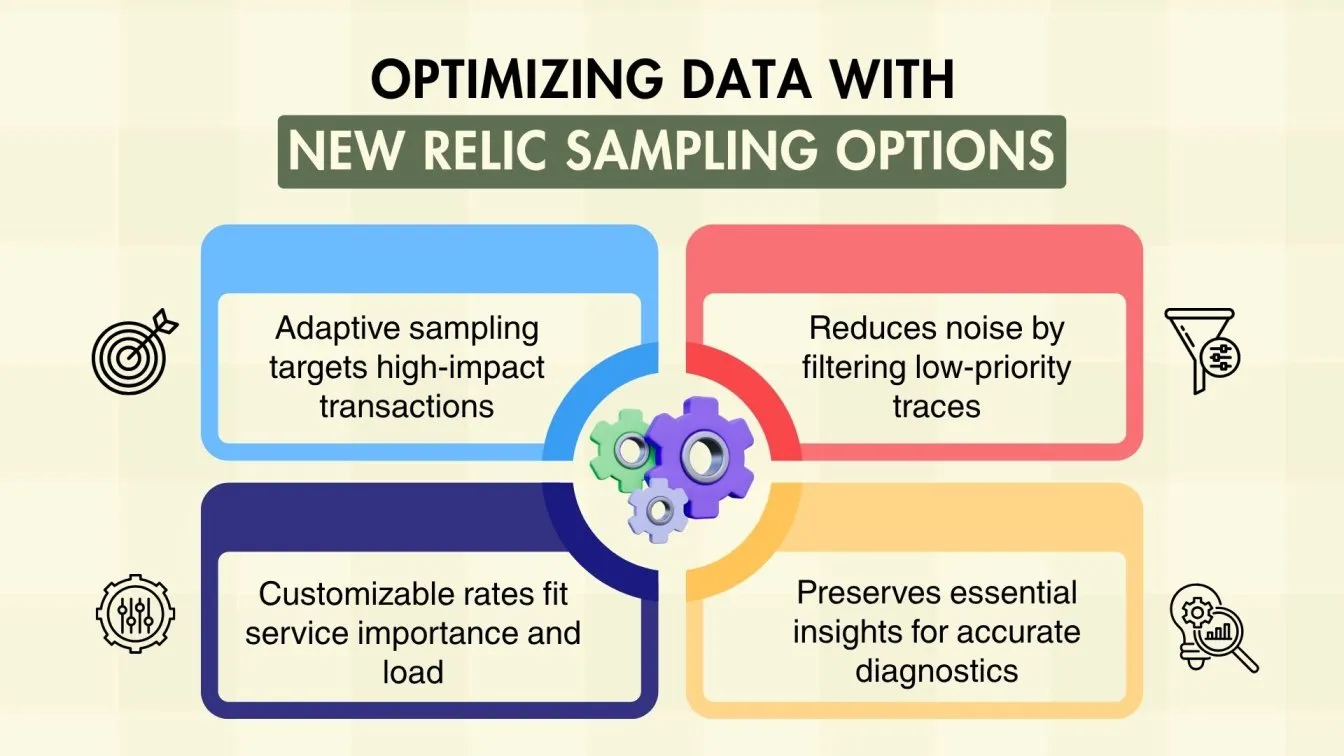
- High cardinality and data overload: With smart sampling options, it avoids data bloat and lets you drop process sample data without losing critical insights.
- Latency issues and slow response times: Through detailed flame graphs and network latency tracking, it pinpoints performance bottlenecks.
- Difficulty in monitoring cross-service requests: Enables seamless context propagation across services, maintaining clarity in individual transactions.
- Scattered performance data: Its unified infrastructure monitoring and observability objectives ensure alignment across the software stack.
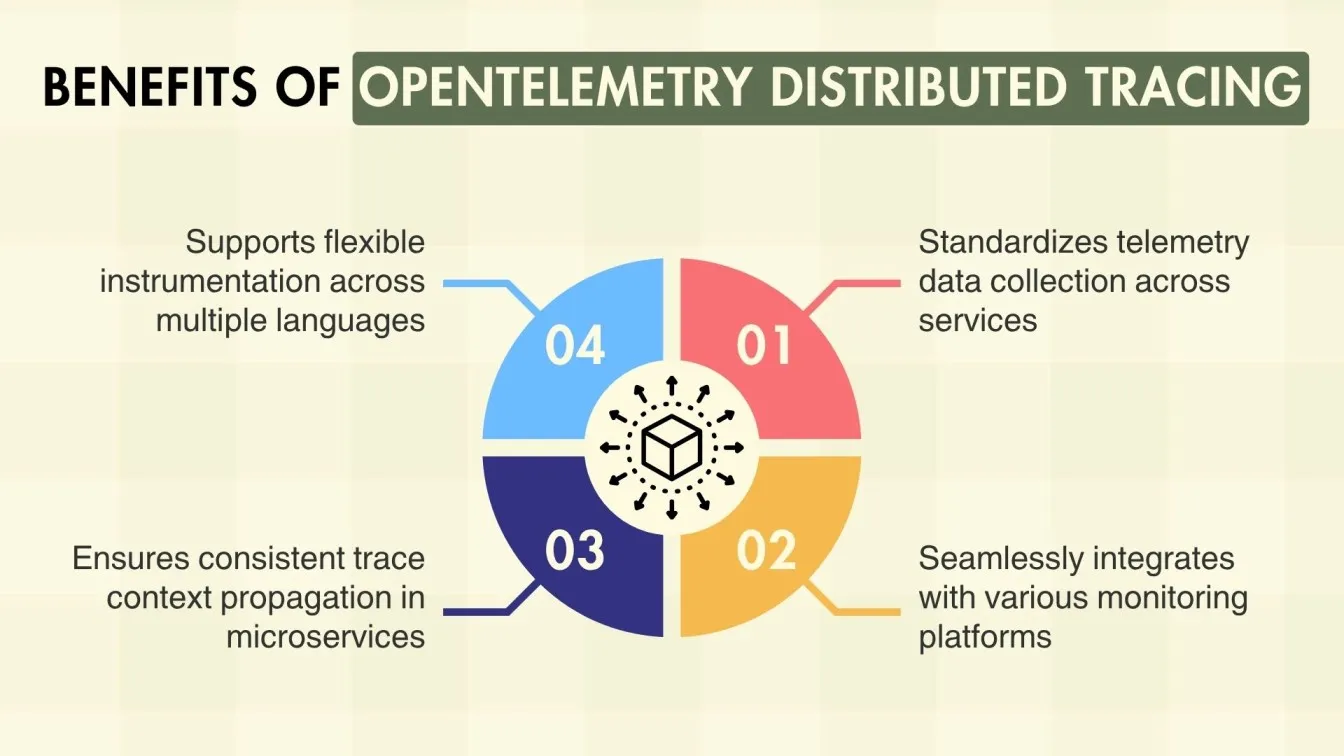
Using OpenTelemetry with New Relic for Seamless Observability
Integrating OpenTelemetry with New Relic enhances observability across microservices-based distributed systems, enabling unified telemetry data collection. This open-source standard allows engineering teams to instrument applications with consistency while leveraging New Relic’s powerful APM monitoring capabilities for real-time insights and optimization.

- Trace context propagation: Maintains consistent tracking of individual transactions across downstream services in a distributed environment.
- Support for multiple programming languages: Enables flexible implementation regardless of the software stack, streamlining onboarding and scalability.
- Detailed insights into trace origin and latency: Identifies performance issues using correlated metrics and logs for faster root cause analysis.
- Seamless integration with New Relic’s tracing dashboard: Offers visualization of network requests, service maps, and dependency diagrams.
- Customizable sampling options: Allows control over telemetry volume and the ability to drop process sample data while preserving key insights.
- Compliance requirements support: Ensures traceability and data governance for business users and regulatory standards.
Best Practices for Microservices Optimization Using New Relic Tracing
Optimizing microservices architecture requires complete visibility into transactions, performance bottlenecks, and dependencies. New Relic tracing solution empowers engineering teams to achieve enhanced observability, reduce latency, and deliver seamless user experiences by applying proven strategies for tracing and diagnostics.
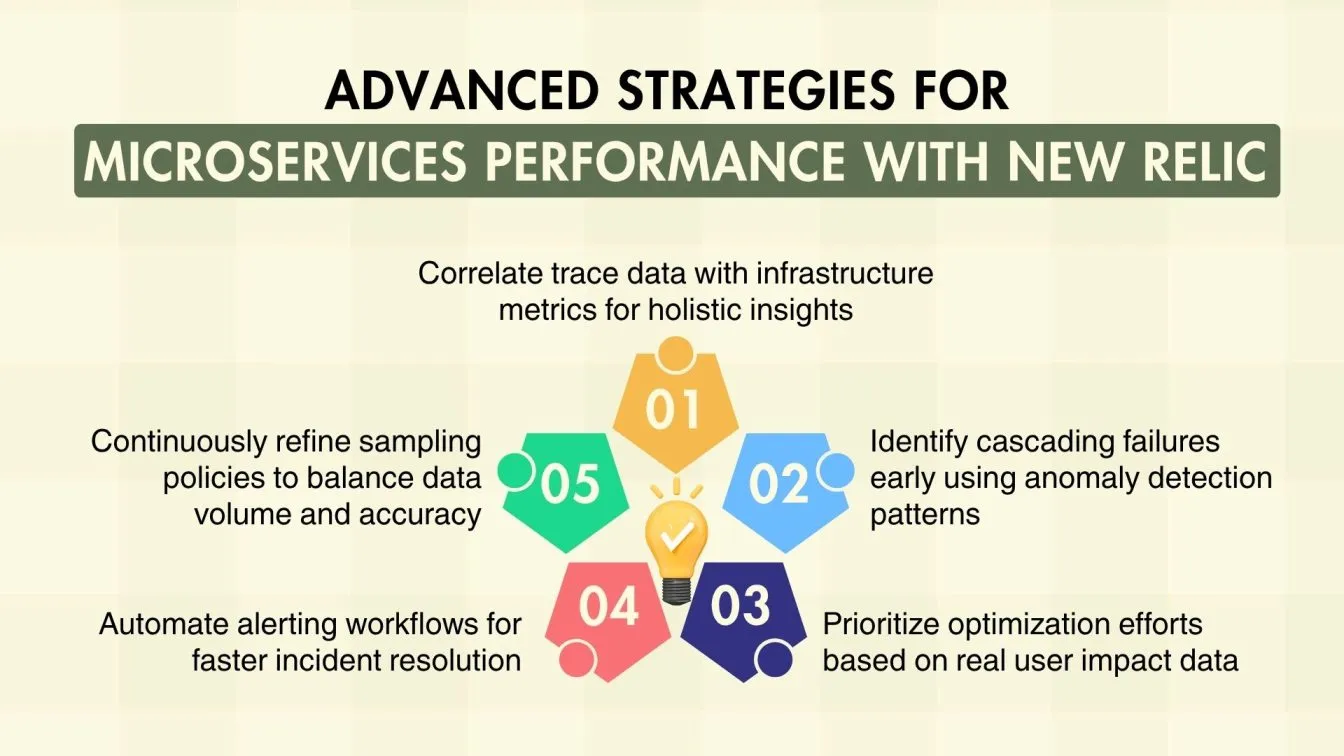
- Set meaningful trace sampling rates: Adjust sampling dynamically to capture enough data for analysis while preventing overload on storage and processing.
- Tag and label traces for easier filtering: Use consistent metadata to categorize services, environments, or transactions to speed up issue identification.
- Automate anomaly detection using baseline metrics: Leverage New Relic’s AI-driven alerts to detect deviations in trace patterns before users experience issues.
- Regularly review and optimize instrumentation code: Ensure that tracing code in microservices is lightweight and does not add significant latency or overhead.
- Incorporate user experience metrics with trace data: Correlate tracing insights with frontend performance metrics to get a complete picture of service impact on customers.
Final Thoughts
New Relic stands out as a powerful observability platform for modern microservices-based distributed systems, offering deep insights, real-time monitoring, and seamless integration with frameworks like Spring Boot and Node.js. With tracing capabilities, dynamic dashboards, and compatibility with tools like OpenTelemetry, it empowers engineering teams to resolve issues faster and boost user satisfaction. For businesses aiming to optimize performance and enhance customer experience observability, New Relic is a smart, scalable choice especially when combined with functional testing, load testing, and AI-driven test automation services to ensure performance stability and end-to-end quality assurance.
Frugal Testing has emerged as a leading software testing company known for innovative services like functional testing solutions, load testing services, and AI-driven test automation services. Recognized among the top software testing companies in USA, it offers value-driven QA through platforms like frugaltesting.com. With deep expertise in selenium automation testing service and cloud-based test automation services, Frugal Testing supports robust digital experiences for modern businesses across industries.
People Also Ask
Can New Relic trace requests across multiple services?
Yes, New Relic provides end-to-end distributed tracing that captures and visualizes requests flowing across multiple services in a microservices architecture.
Is New Relic distributed tracing compatible with Kubernetes environments?
New Relic fully supports distributed tracing in Kubernetes and other cloud-native environments, enabling seamless observability in containerized microservices.
What is the role of the New Relic agent in distributed tracing?
The New Relic agent automatically instruments applications to capture trace data, enabling end-to-end visibility into service calls and transaction flows.
How do I correlate logs and traces in New Relic?
You can correlate logs and traces by enabling log context injection, which links log entries with trace and span IDs for unified observability.
What is the difference between spans and traces in New Relic?
A trace represents the full journey of a request across services, while spans are individual units of work within that trace, detailing each step's performance.