-p-500.webp)

Installation and Executing JMeter in Different Modes
Apache JMeter is an Open Source Software, a pure 100% Java Application developed for load testing and Performance Testing. For those who are new to JMeter, here is a step-by-step guide on How to Install JMeter and How to run JMeter in different Modes.
Steps to Install JMeter
Step 1: Install Java
Since JMeter is a 100% pure Java Application, One of the main prerequisites is JVM 6 or Higher. You can download and install the latest version of the Java SE Development Kit here.
After installation is completed, you can follow the following procedure to check whether Java JDK is successfully installed in your system-
1. In Windows/ Linux, Open the Terminal.
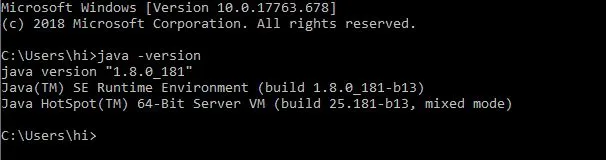
2. Enter the command java-version.
If Java JDK is successfully installed, you will see the following output screen:
If nothing displays, Please follow the step by step installation guide from Java Platform, Standard Edition Installation Guide.
Step 2: Download JMeter
After the successful installation of Java JDK, the next step is to download the Apache JMeter Binaries here. Choose either zip/tgz file from the Binaries as shown in the figure below-
Step 3: Install JMeter
JMeter Installation is very easy. All you need to do is to unzip the zip/tgz file to the desired directory. There are no tedious steps to be followed, Just Unzip and You are ready to go!
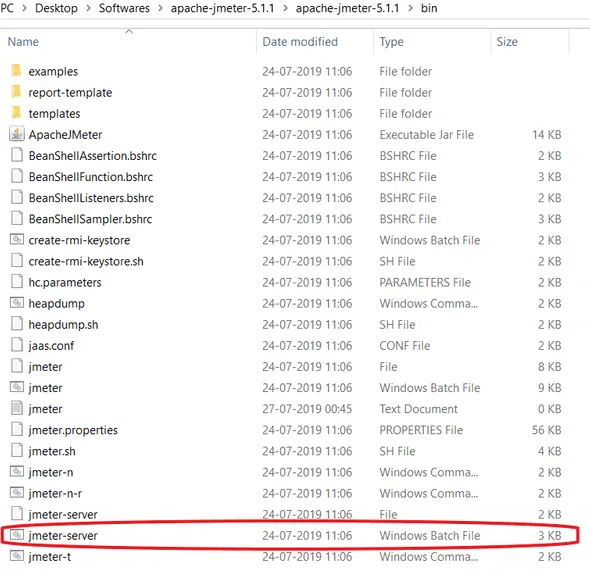
Once Unzip is done, the Installation Directory structure looks like this-
Before proceeding further we will have a brief discussion about the important components in the directory structure.
1. /bin: This directory contains script files for starting JMeter
2. /docs: Directory consists of JMeter Documentation Files.
3. /extras: Directory consists of ant related extra files.
4. /lib: Contains the required Java Library for JMeter.
5. /lib/ext: This Directory consists of core jar files for JMeter and Protocols.
Step 4: Launch JMeter
JMeter can be launched in 3 ways, each mode catering a special requirement.
- GUI Mode
- Server Mode
- Command Line Mode
But do we really need these many modes or a single mode can cater to all the scenarios? The answer is YES!!! We cannot use JMeter GUI Mode to perform Load testing. For this, we need less power-consuming Command Line Mode. Similarly in a Distributed environment where there is Client-Server Architecture, we need a special mode for the Server System.
So in a nutshell, a Single running mode for JMeter is not sufficient to handle all the environments.
Let’s begin with a detailed discussion of Modes. This will help you to gain insight into why different modes are required.
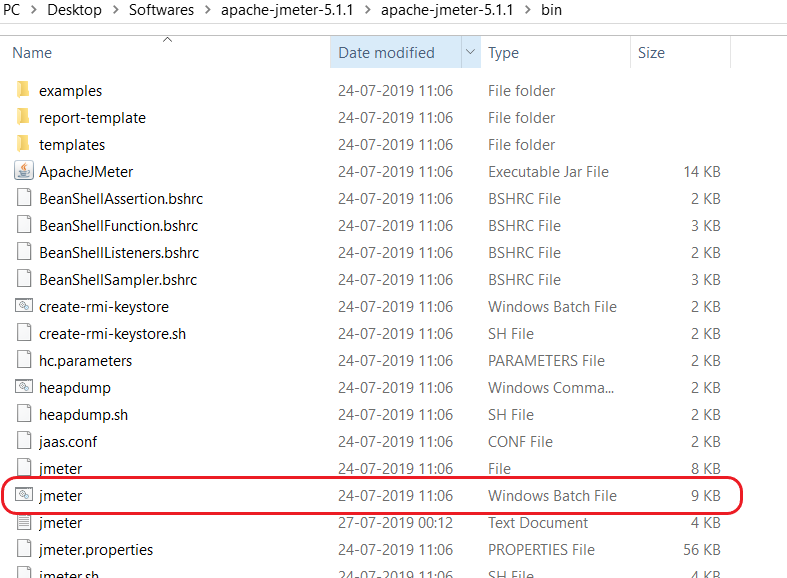
GUI Mode:
If you are using Windows, navigate to the bin folder in the installed directory. You will find a Windows Batch File under the name jmeter.bat
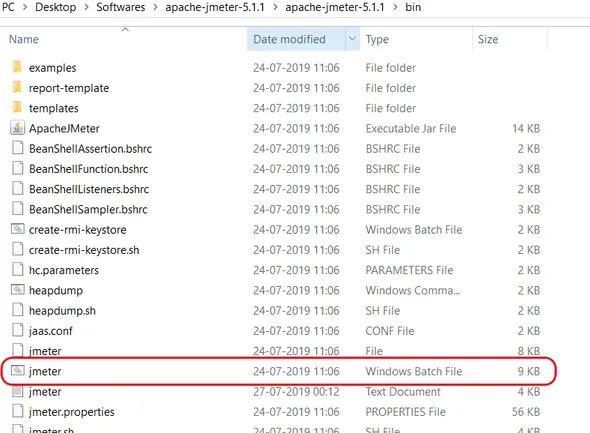
Just execute this Batch File and You will see the Apache JMeter Windows.

Server Mode:
Server Mode is designed for Distributed Testing Environment like a Client-Server Model, where Apache JMeter will run in the Server Mode on Server Computer and in GUI Mode on the Client Computer.
To start JMeter in Server Mode, just execute the Windows Batch File JMeter-server.bat in the bin directory.
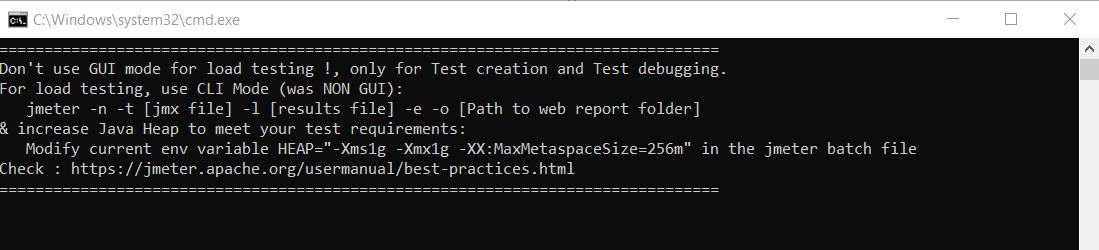
Command Line Mode:
Running JMeter in GUI Mode consumes a lot of computer memory. This is why it is not advisable to run JMeter in GUI Mode for Load Testing.
To save resources, you may choose to execute JMeter in Command Line Mode.
- Open the command prompt.
- Navigate to the bin folder in the Apache JMeter directory.
- Execute the following command.
JMeter -n -t SampleTest.jmx -l testlog.jtl
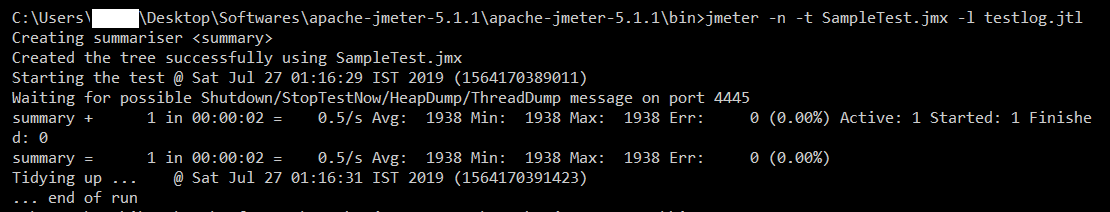
-n: Specifies JMeter to run in Non-GUI Mode.
t: Specifies the name of JMX File containing the test plan.
-l: Specifies the name of the JTL file to log test results.
Other than these options, there are so many parameters available. You can find the list of the parameter from Apache JMeter- User’s Manual.
Once your test is complete, you can see the log file using the GUI Mode.
- Open the JMeter in GUI Mode.
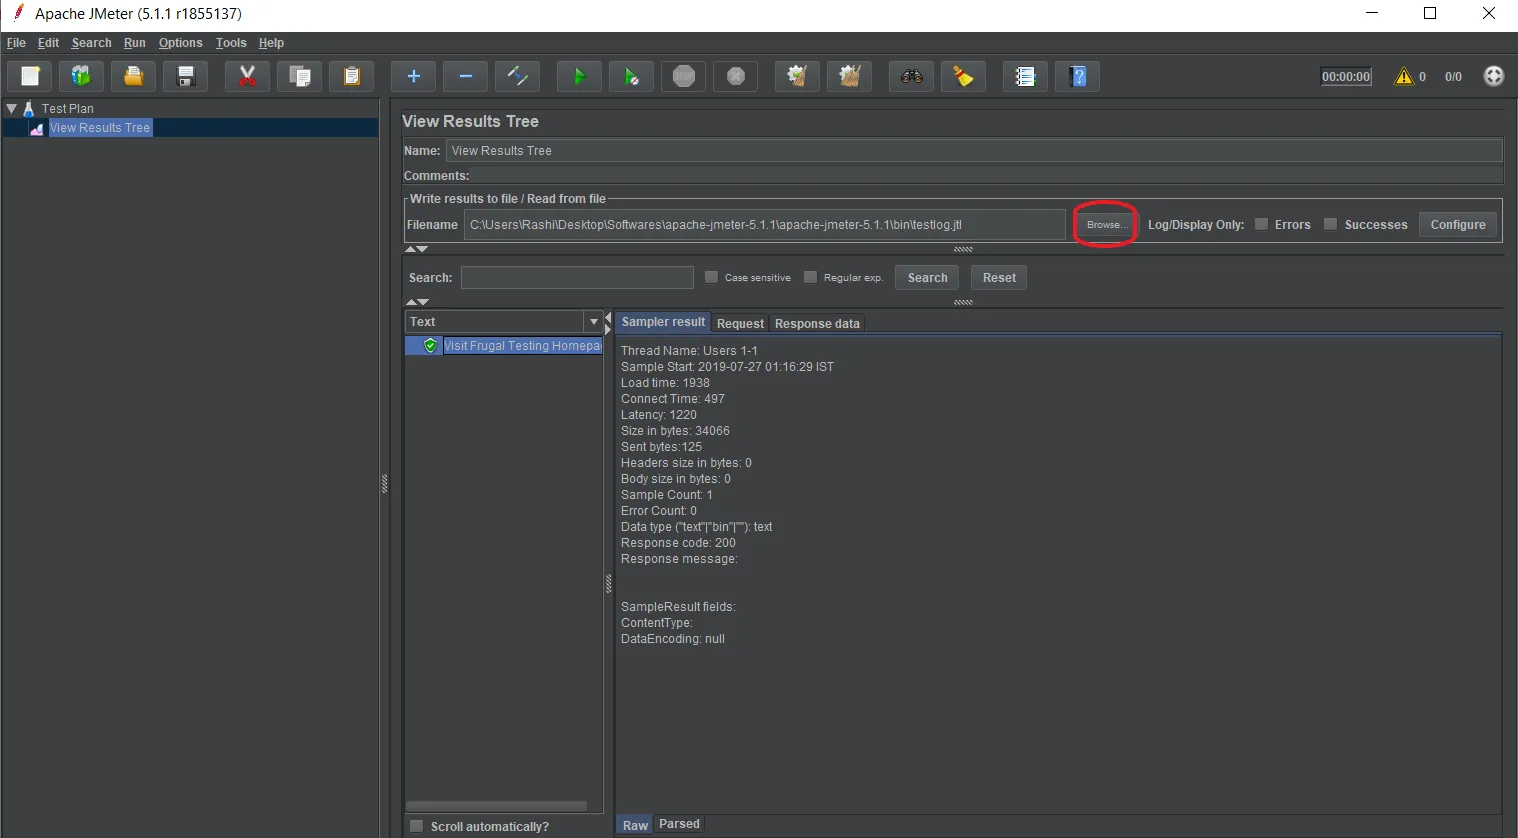
- Add any Listener by right-clicking on Test Plan > Add > Listener > View Results Tree.
- Now click on the Browse button and select the log file. In our case it is testlog.jtl
- You should be able to see the result in the listener.
After having such a long discussion on JMeter, now you guys are ready to start installing JMeter and try running it in various modes.
Test Plan Components and Running a Test Script
Creating a Complete Test Plan
For the beginners let’s keep things straight and start with a basic example of a Test Plan which tests a web page. We will be using our company’s website www.frugaltesting.com.
Follow the steps below for creating a Test Plan.
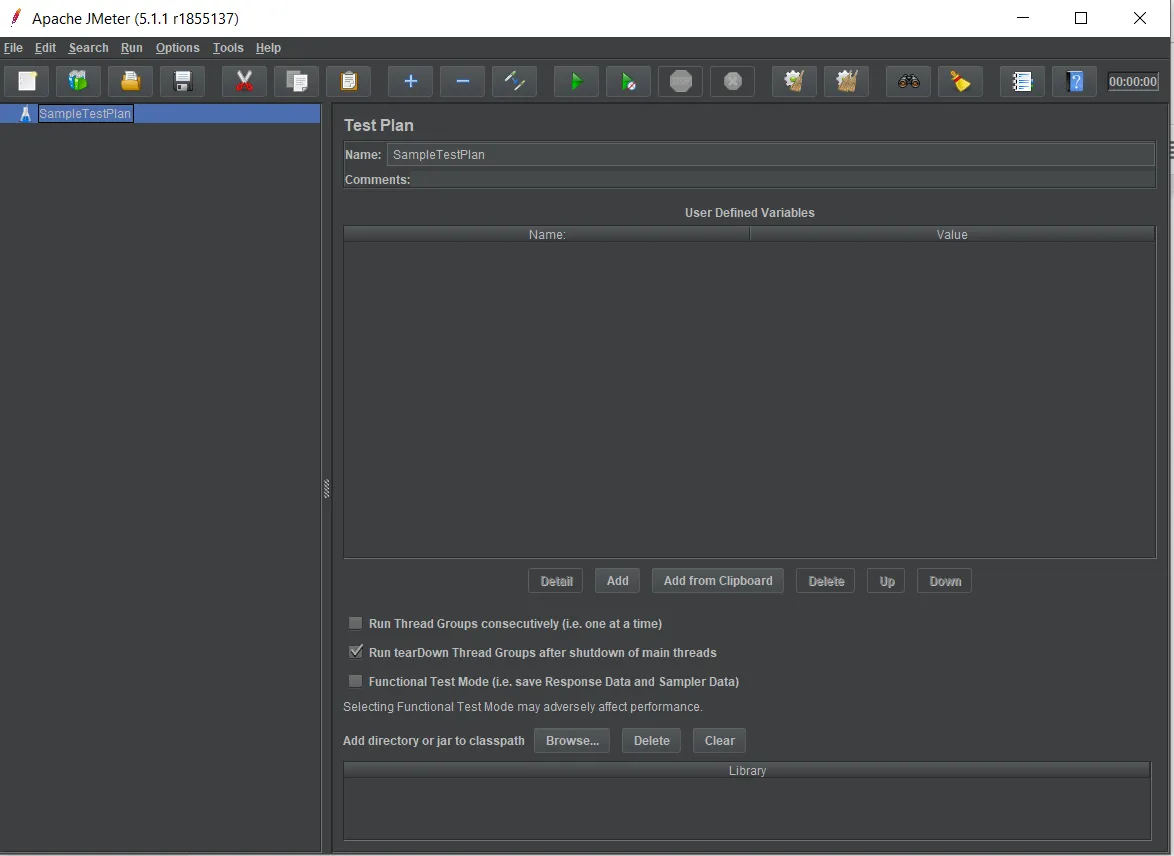
1. Start JMeter
In this example, we will start JMeter in GUI Mode by running the jmeter.bat file located in the /bin directory. JMeter Interface will look like this:
2. Rename the Test Plan
Change the name of the Test Plan to SampleTestPlan in the Test Plan node. Change the focus from Test Plan node to Workbench node to get the change reflected.
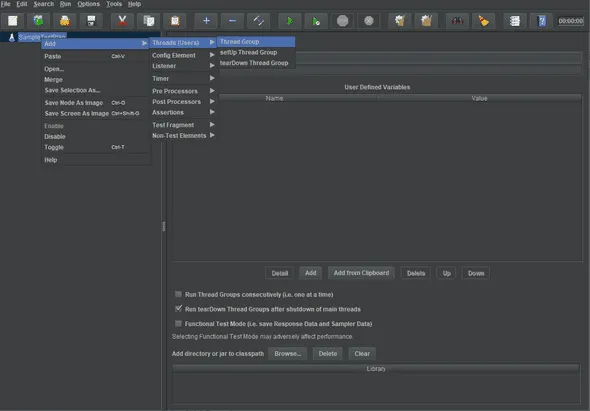
3. Add a Thread Group
To configure a Test Script, the first step is to add a Thread Group. It acts as a placeholder for all other elements like Sampler, Listener, and Controllers.
Each Thread Group represents a User where Thread Group stimulates how users behave on an app.
In JMeter, all nodes are added using the Context Menu:
1. Right-click on the Node for which you want to add a child element.
2. Choose the appropriate element to add.
3. To add Thread Group, Right Click on the SampleTestPlan → Add → Thread(Users) → Thread Group.
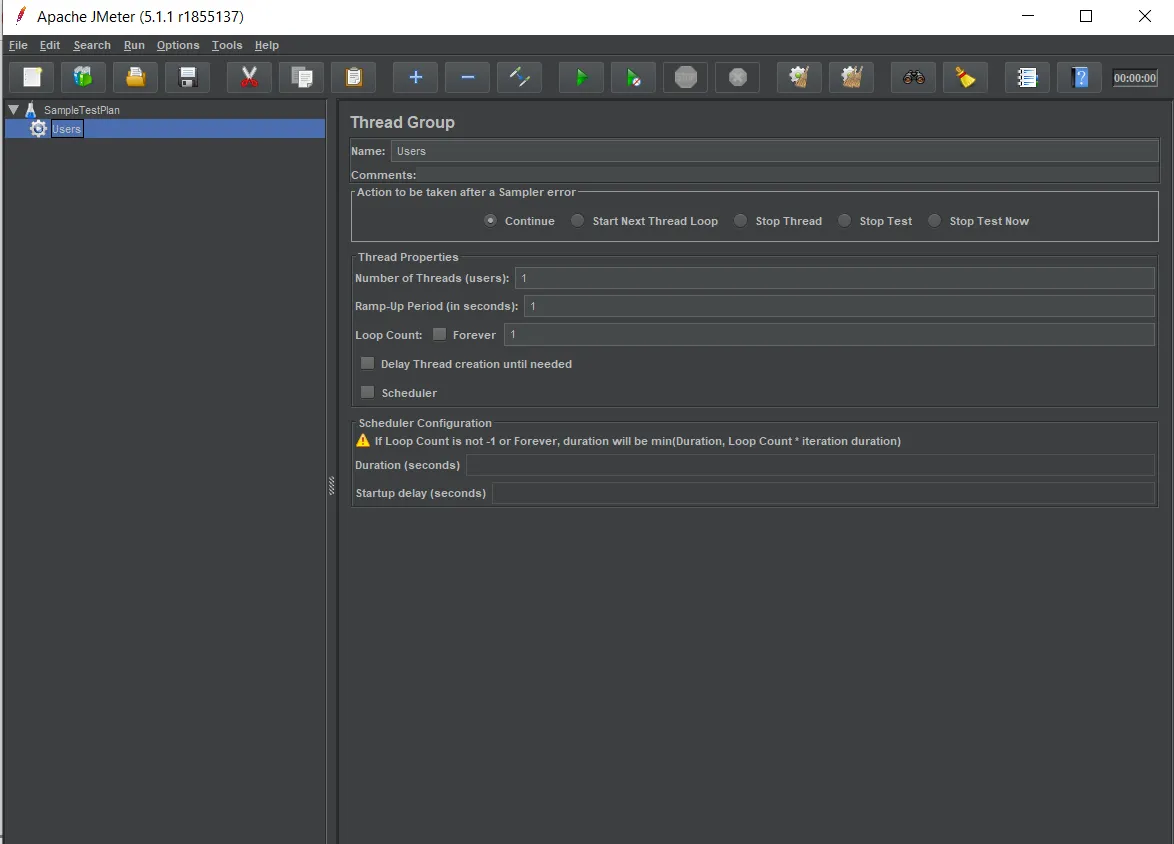
Configure the Thread Group:
- Name: Can be anything. Here we have set it to Users.
- Number of Threads: This means the number of Users we want to stimulate. In this example, we are keeping it to the default value 1.
- Ramp-up Time: How much time to allow a Thread Group to go from one user to another. In this example, as only 1 thread is there, we are setting it to the default value.
- Loop Count: This means how many times the test should be looped.
4. Add Sampler
We need to send HTTP Request to the web page, for this we need to add a Sampler. Here we are adding HTTP Request type of Sampler. There are 20 types of Sampler available.
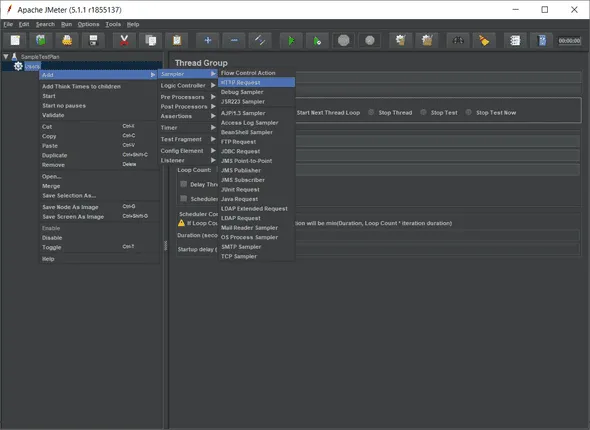
For adding a Sampler, Right Click on Thread Group (Users) added in the previous step→Add→Sampler→HTTP Request.
Configure the Sampler:
- Name: Set up a name for Sampler. For this example, we have named it ViewFrugalTesting.
- Server or IP: Mention the server or IP that you intend to test. For this case it is www.frugaltesting.com. *https:// or http:// will not be part of this field.
- Protocol: We will let this be a default value (HTTP) by keeping it blank.
- Path: We type slash(/) in the Path field. This means we want to query the root or we can say the main page.

5. Add Timers
Whenever we open a website, there are always naturally some sort of delays and pauses. These delays and pauses can be stimulated with the help of Timers.
Constant Timers are the most common, though there are 8 types of timers available.
To add a Timer Right-click on the Sampler→ Add→ Timer→ Constant Timer.
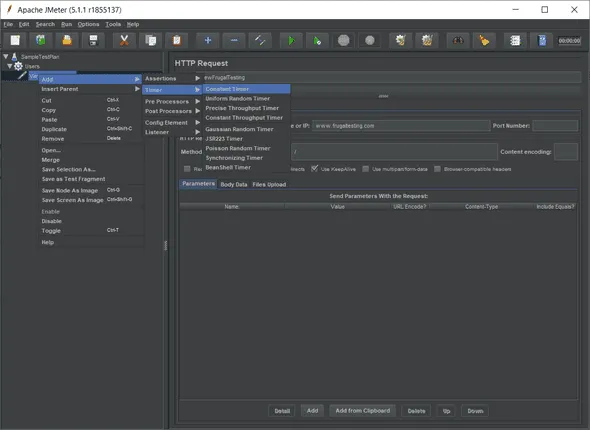
In this case, we are keeping 300 milliseconds.
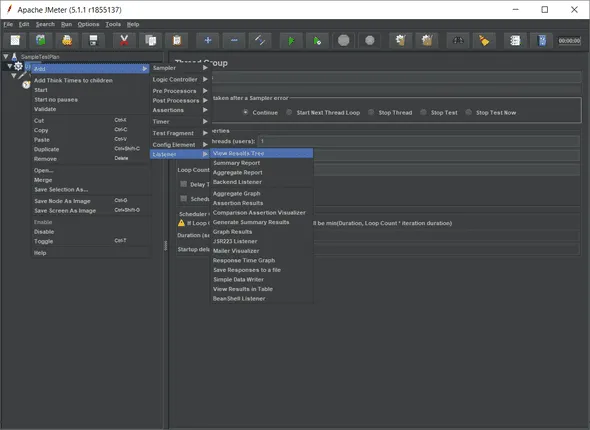
6. Add Listener
One of the most important steps in test plan executing is logging and debugging the results. Obviously, we want to see the results. This is possible with the help of Listeners.
View Result Tree is the most common type of Listener. There are 16 types of different Listeners that are available.
To add a Listener Right Click on Thread Group(Users)→Add→Listener→View Result Tree.
Now click on the save option and your Test Plan will be saved as a .jmx file.
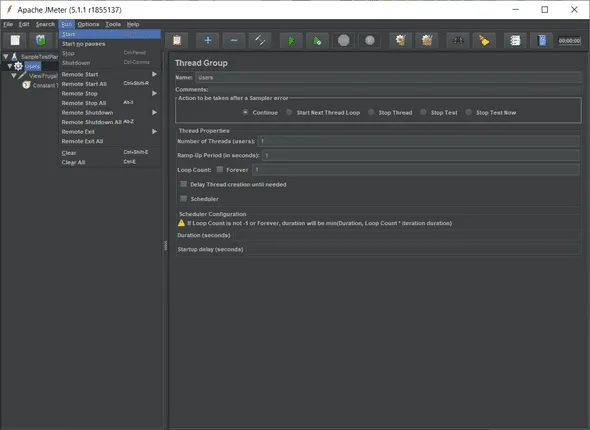
7. Run the Test Plan
With all the configuration done, Let’s run the Test Plan. Since we have kept the default values for the Thread Group, it means it will stimulating as a single user.
To execute the Test Plan, all you need to do is just select the Run option from the menu and then select the Start option.
NOTE: Even if you forget to save the file after finishing the setup or in the beginning, when you try to execute the file it will automatically prompt you to save the file.
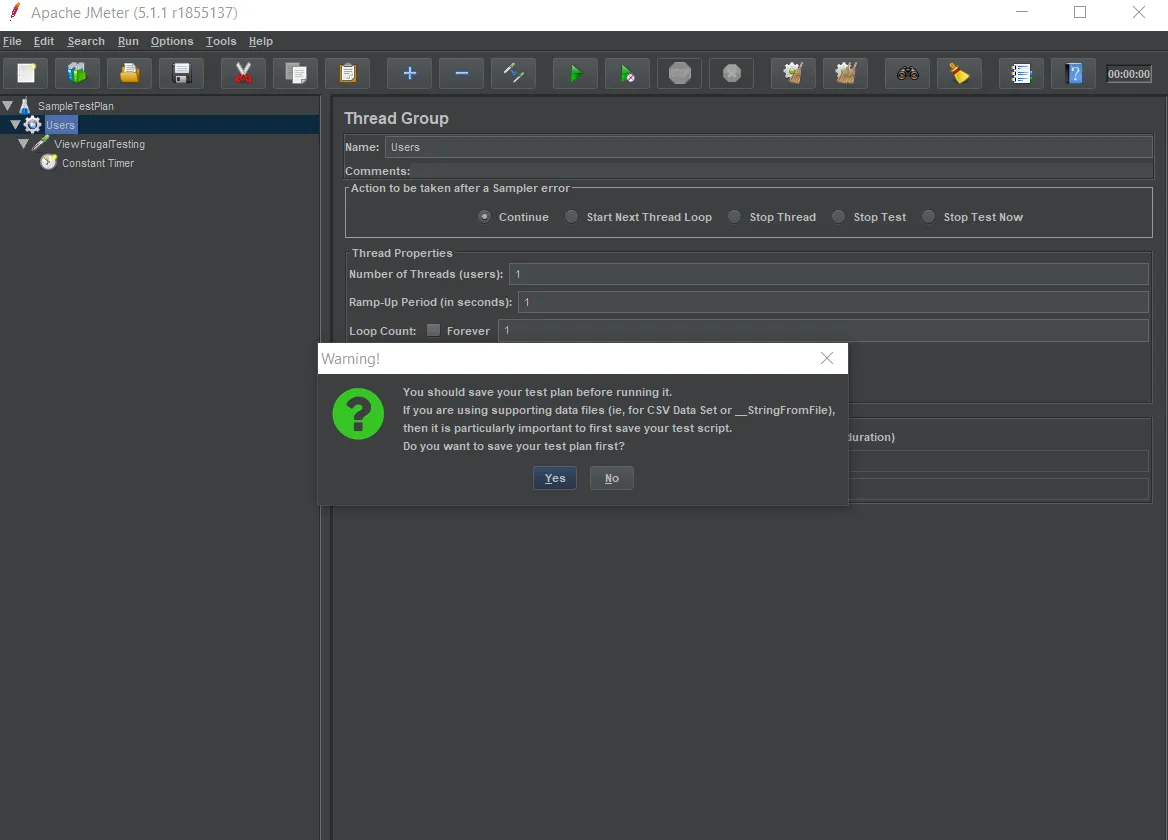
Click on the Yes option and you are ready to save and execute the Test Plan. You can also opt not to save the file and execute(without saving).
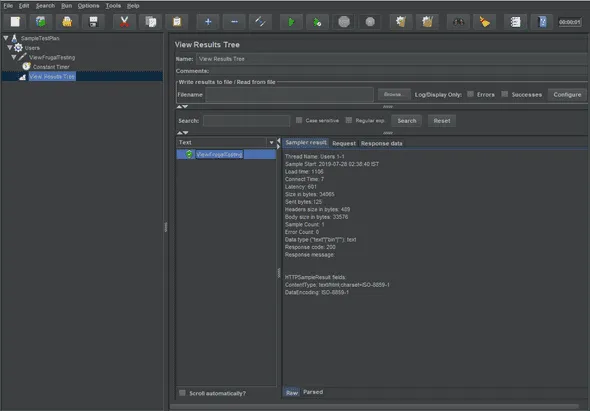
8. View the Output
To view the output of the Test Plan run use View Results Tree (which we already added).
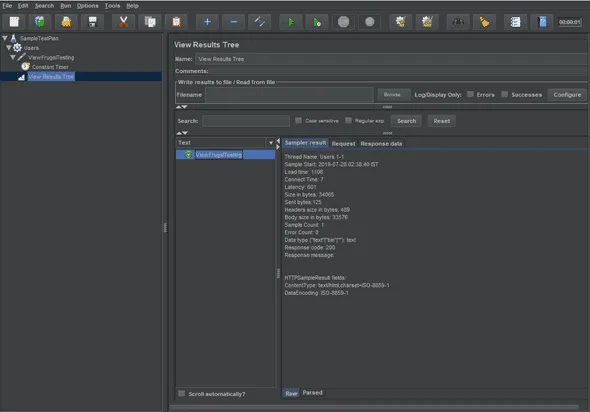
What the output exactly means:
- The success of the Test Plan is marked by the green color shield symbol next to the name ViewFrugalTesting.
- There are 3 headers in the result section- Sampler result, Request and Response Data.
- Sampler results show 2 types of data- JMeter Data and the Data returned by the webserver.
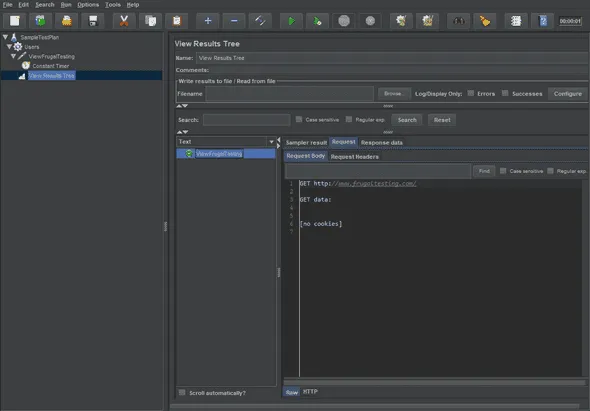
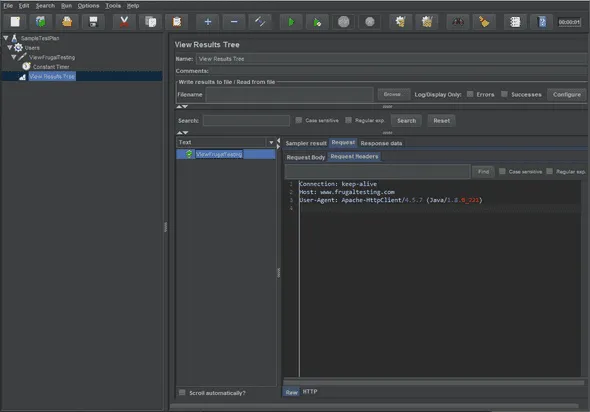
- The request tab shows the data sent as a part of request to the webserver.
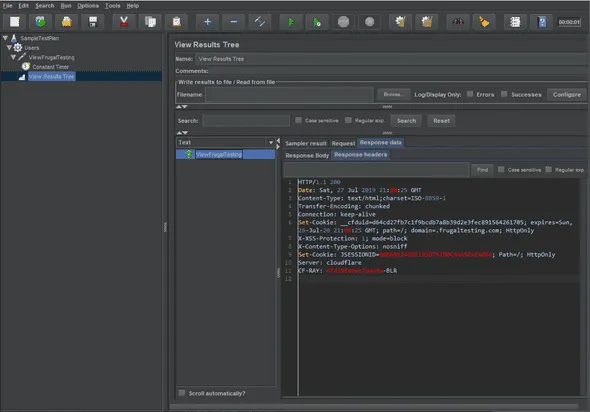
- The response tab shows the data returned by a web server in the form of a text.

Now Finally we are capable of running a simple and basic Test Script in JMeter. We are also able to analyze the results.
Keep practicing, we will be back with a list of Top 10 Plugins in JMeter as per Usage Statistics.