

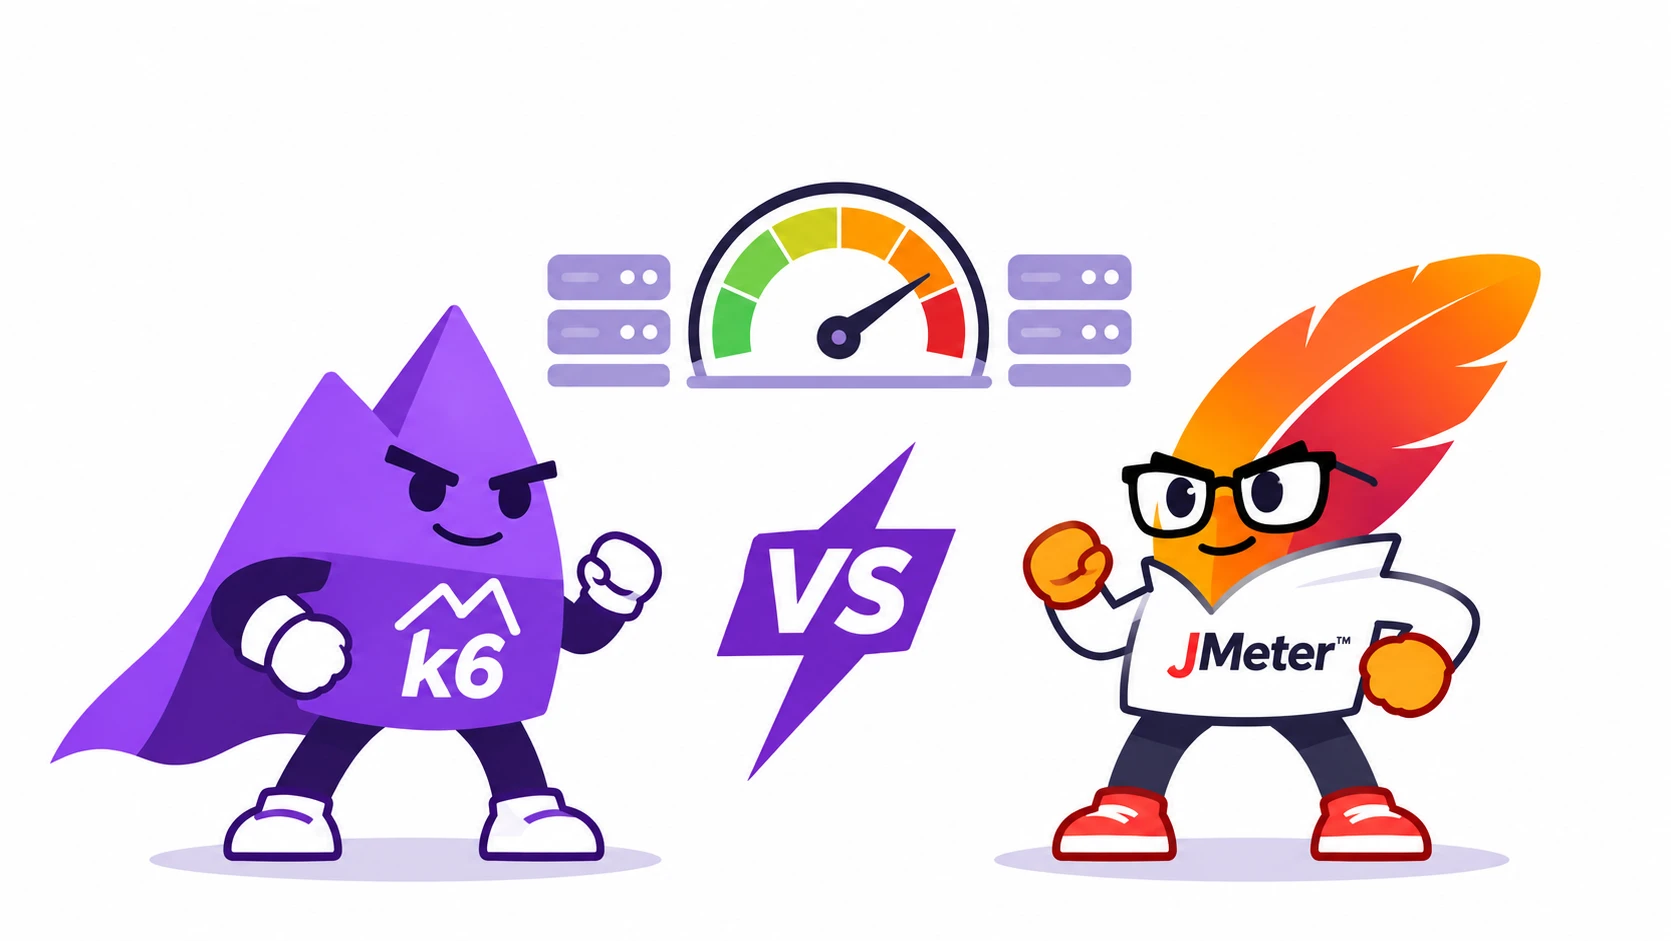
A team preparing for a seasonal traffic peak has two load testing tools on the shortlist and a fixed delivery deadline. One is scripted in code and lives in the repository, while the other is built in a GUI and reaches databases and queues. Both are credible choices, and neither is automatically the default answer.
This guide compares k6 load testing and Apache JMeter on authoring, scale, protocols, reporting, and CI/CD. You will see where each tool fits, where it struggles, and how to choose based on team skills and protocol mix. We also cover migration effort and how to run a proof of concept on your own APIs.
k6 and JMeter: Two Load Testing Tools Explained
What is performance testing? It checks how fast and stable an application stays under traffic. The main types are load testing for expected traffic, stress testing beyond the limit, and volume testing for large data sets. Both tools below are performance testing software built for these jobs, but they come from different eras and suit different teams.
What is Grafana K6?
The k6 load testing tool is open source, written in Go and maintained by Grafana Labs. It treats every performance test as code that lives beside the service, which suits modern web applications and APIs. The features that matter most:
- Scripting: JavaScript or TypeScript files, run from the CLI.
- Virtual users: lightweight goroutines.
- Thresholds: pass or fail limits defined in the script.
- Protocols: HTTP, WebSockets, gRPC, and a browser module, plus xk6 extensions.
- Reporting: CLI summary, Grafana and Prometheus.
- Licence: AGPL, with a paid cloud option.
What is Apache JMeter?
Apache JMeter is an open-source Java load testing tool from the Apache Software Foundation. The JMeter download is a single archive, and you build tests in a GUI. Its main features:
- Authoring: GUI plans saved as .jmx XML files, with Groovy for logic.
- Virtual users: one OS thread each on the JVM.
- Protocols: HTTP, SOAP, JDBC for databases, JMS, LDAP, FTP, and mail.
- Logic: timers, assertions, and a built-in HTTP(S) recorder.
- Scale: native controller and worker mode.
- Reporting: offline HTML dashboard and JTL result files.
- Licence: Apache licence.
K6 vs JMeter: Quick Comparison
JMeter is a GUI-driven protocol toolbox, while k6 is a code-first tool built for developers. Most rows below follow from that one difference.
The Core Tradeoffs
A load test tool should fit the people who maintain it, not just the traffic it generates. Four decisions separate the two in practice, namely how tests are written, how much hardware they need, which protocols they reach, and how results gate a build.
Developer Experience and GitOps
JMeter plans are XML files edited through a GUI, while k6 tests are JavaScript files reviewed like any other source code. The abridged samples below show the same GET request in each.
JMeter
- Plans are .jmx XML, so one GUI click can rewrite dozens of different lines.
- Testers can build requests visually without writing code.
- It runs from the command line in non-GUI mode under real load, which suits JMeter CI/CD pipelines.
<HTTPSamplerProxy testname="GET orders">
  <stringProp name="HTTPSampler.domain">api.example.com</stringProp>
  <stringProp name="HTTPSampler.path">/orders</stringProp>
  <stringProp name="HTTPSampler.method">GET</stringProp>
</HTTPSamplerProxy>
<ResponseAssertion testname="Status is 200">
  <stringProp name="Assertion.test_field">Assertion.response_code</stringProp>
  <stringProp name="49586">200</stringProp>
</ResponseAssertion>
k6
- Scripts for k6 performance testing are plain code, so a pull request shows exactly what changed.
- Developers and SDETs get readable reviews and reusable modules.
import http from 'k6/http';
import { check } from 'k6';

export default function () {
  const res = http.get('https://api.example.com/orders');
  check(res, { 'status is 200': (r) => r.status === 200 });
}
Resource Footprint and Performance Scale
The virtual user model decides how much hardware a run needs. Measure injector CPU and memory on your own workload before sizing runners. More concurrent users per machine does not make a better tool, and the gap matters mainly on small runners or when tests run on every pull request.
JMeter
- One OS thread per virtual user on the JVM, so heap tuning matters.
- JMeter load testing on a small CI runner can hit memory limits first.
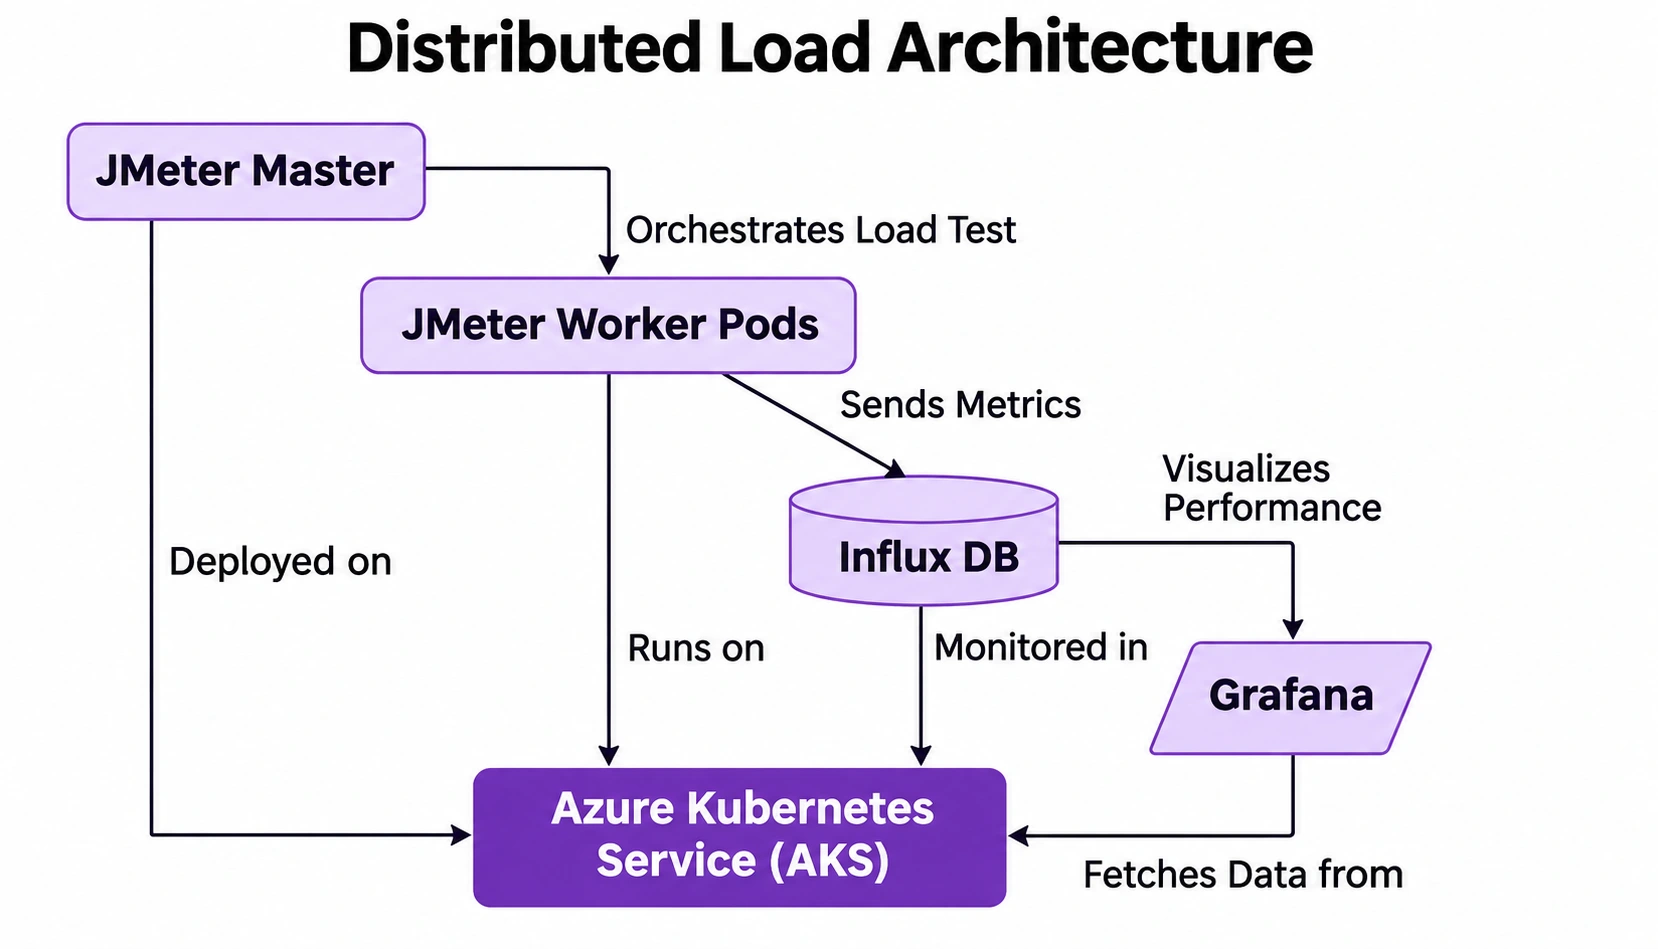
- Large runs distribute through native controller and worker mode across several machines or a managed service such as Azure Load Testing.
k6
- One goroutine per virtual user, with no JVM tuning.
- Large runs distribute through the k6 Operator on Kubernetes or Grafana Cloud k6.
Protocol Breadth vs Modern Web API Focus
Pick by the technologies your systems actually speak. Neither tool suits large-scale real-browser load, since 500 browser users cost far more than 500 protocol-level ones.
JMeter
- JDBC, JMS, LDAP, SOAP and FTP natively.
- Database testing and message broker load run through JDBC and JMS samplers, even when the bottleneck sits in the database tier.
- A built-in recorder captures browser traffic for quick first drafts.
k6
- HTTP, WebSockets, and gRPC natively, which fits API load suites that live in the repo.
- A browser module drives real browser actions.
- xk6 extensions add SQL, Redis, and Kafka.
Automation, Observability, and SLOs
Both tools run headless in a pipeline, so the real difference is where the pass or fail gate lives. In k6, that gate sits inside the script, while JMeter usually needs plugins or external scripts reading the results. It is how a team turns an SLO, such as p95 latency under 200 ms, into a build result.
JMeter
- No native test-level thresholds, so teams use external tools such as the Performance Plugin, Taurus, or scripted checks on the JTL file.
- An offline HTML report is generated from the JTL result files.
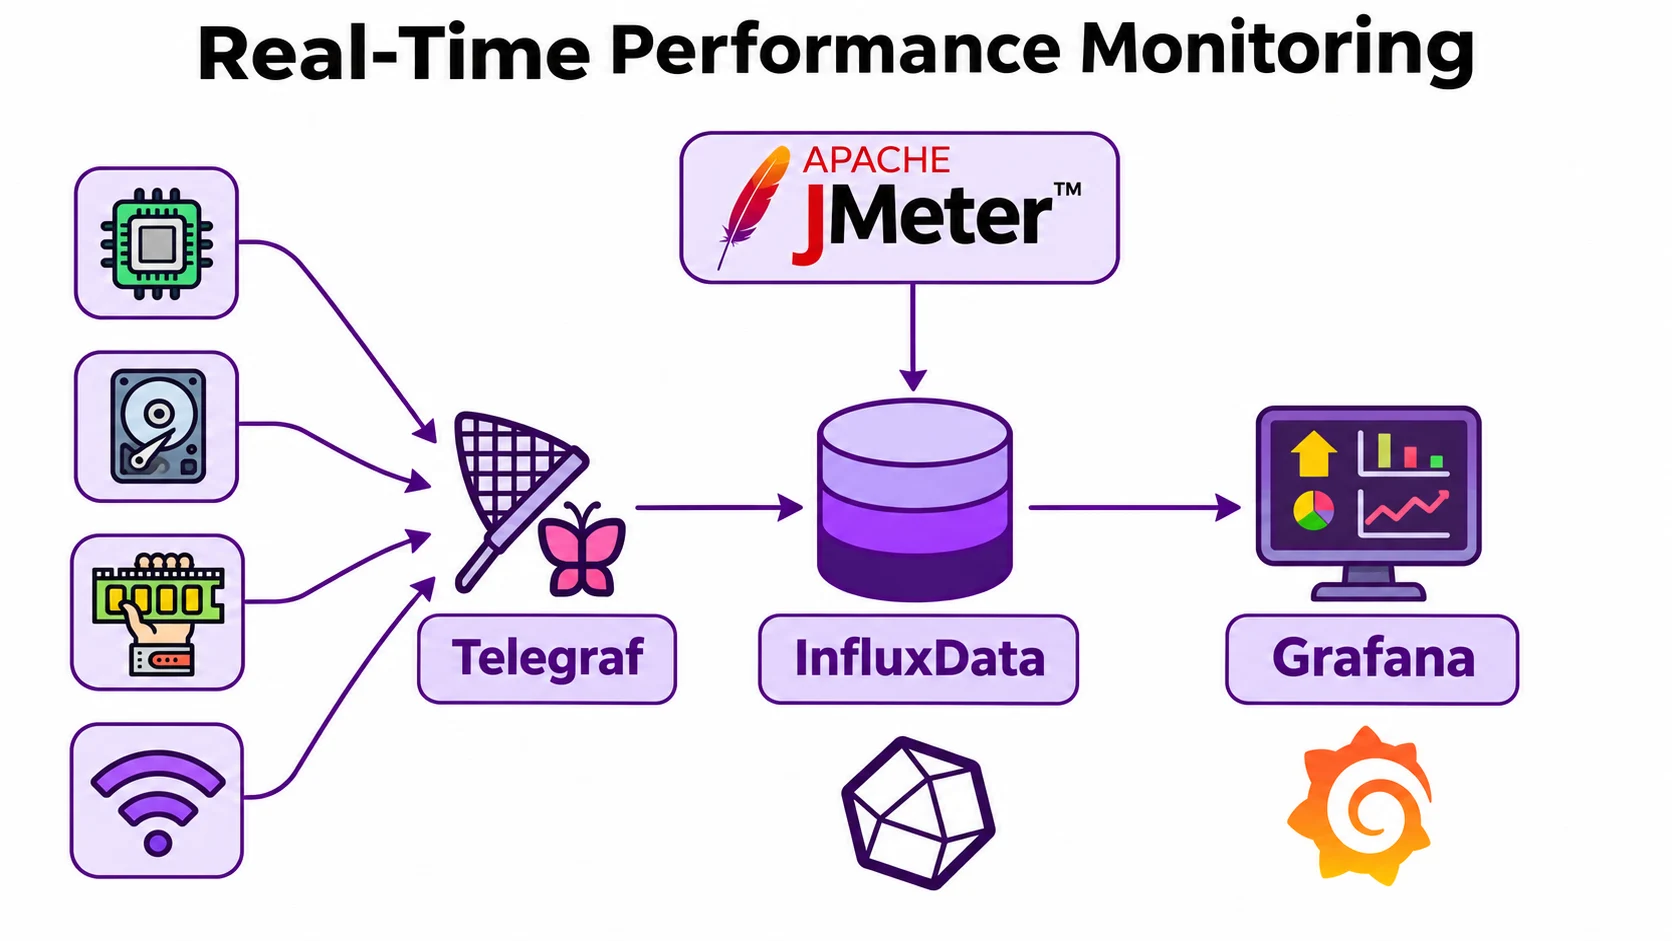
- A backend listener feeds InfluxDB.
k6
- Thresholds live in the script and can encode an SLO, and a miss exits non-zero to fail the build.
- Metrics stream to Grafana, Prometheus, and InfluxDB for analysis and dashboards.
- A built-in web dashboard can export a self-contained HTML report, so offline reporting is not exclusive to JMeter.
export const options = {
  thresholds: { http_req_duration: ['p(95)<200'] },
};
Which Load Testing Tool Wins Your Use Case?
k6 is the stronger pick for developer-owned API and microservice scenarios in CI/CD, while JMeter is stronger for non-web protocols and GUI-driven QA teams. Both are free load testing software and rank among the most used performance testing tools. Python teams can evaluate Locust load testing too.
Before committing, run a short proof of concept on your own APIs, ideally inside your existing test automation framework, with the same workload model, think time, data, and environment, and measure injector CPU, memory, and failure modes alongside latency. The official JMeter-to-k6 converter is archived and unmaintained, so moving either way means rewriting scenarios, correlation, and data feeds.
When to Choose Apache JMeter
- Non-HTTP protocols such as JDBC, JMS, LDAP, or FTP.
- GUI recording and authoring for mixed-skill teams.
- An existing .jmx library that already works.
- Offline HTML dashboards generated from JTL result files.
- An Apache licence requirement.
- Large enterprise estates spanning many platforms and legacy systems.
When to Choose Grafana k6
- HTTP and gRPC tests at high virtual user density per CPU.
- Scripts in JavaScript or TypeScript reviewed in pull requests.
- Thresholds as code to gate CI on latency and error rate.
- Developers owning performance tests in the same repo as the service.
- API and microservice scenarios that go through code review.
- Grafana-native stacks for dashboards.
How Frugal Testing Helps With k6 and JMeter Performance Testing
Most teams already have a tool and lack the hours to build load tests properly. We are an automated testing company, and we write and run performance tests with k6 and JMeter scripts when a suite has outlived its author or nobody on the team owns performance.
The usual cause of a useless load test is a workload model nobody agreed on. Teams weighing outsourcing QA testing or QA outsourcing services can start with our QA outsourcing guide and get the same engineers for JMeter performance testing and k6, and a mobile testing company engagement can sit alongside.
What Our Performance Testing Engagement Looks Like
Every engagement follows the same four weeks, whichever tool we pick. Skipping any of them is how load tests lose credibility.
- Week 1 (scope): We model real traffic shapes and agree on the workload, think time, and data.
- Week 2 (choose and build): k6, JMeter or both, with thresholds wired into your pipeline.
- Week 3 (run and analyse): We run the scenarios, tune and report bottlenecks.
- Week 4 (hand over): You get every script, threshold, and a results readout, and can run them without us.
Choose the Tool Your Team Will Still Maintain Next Year
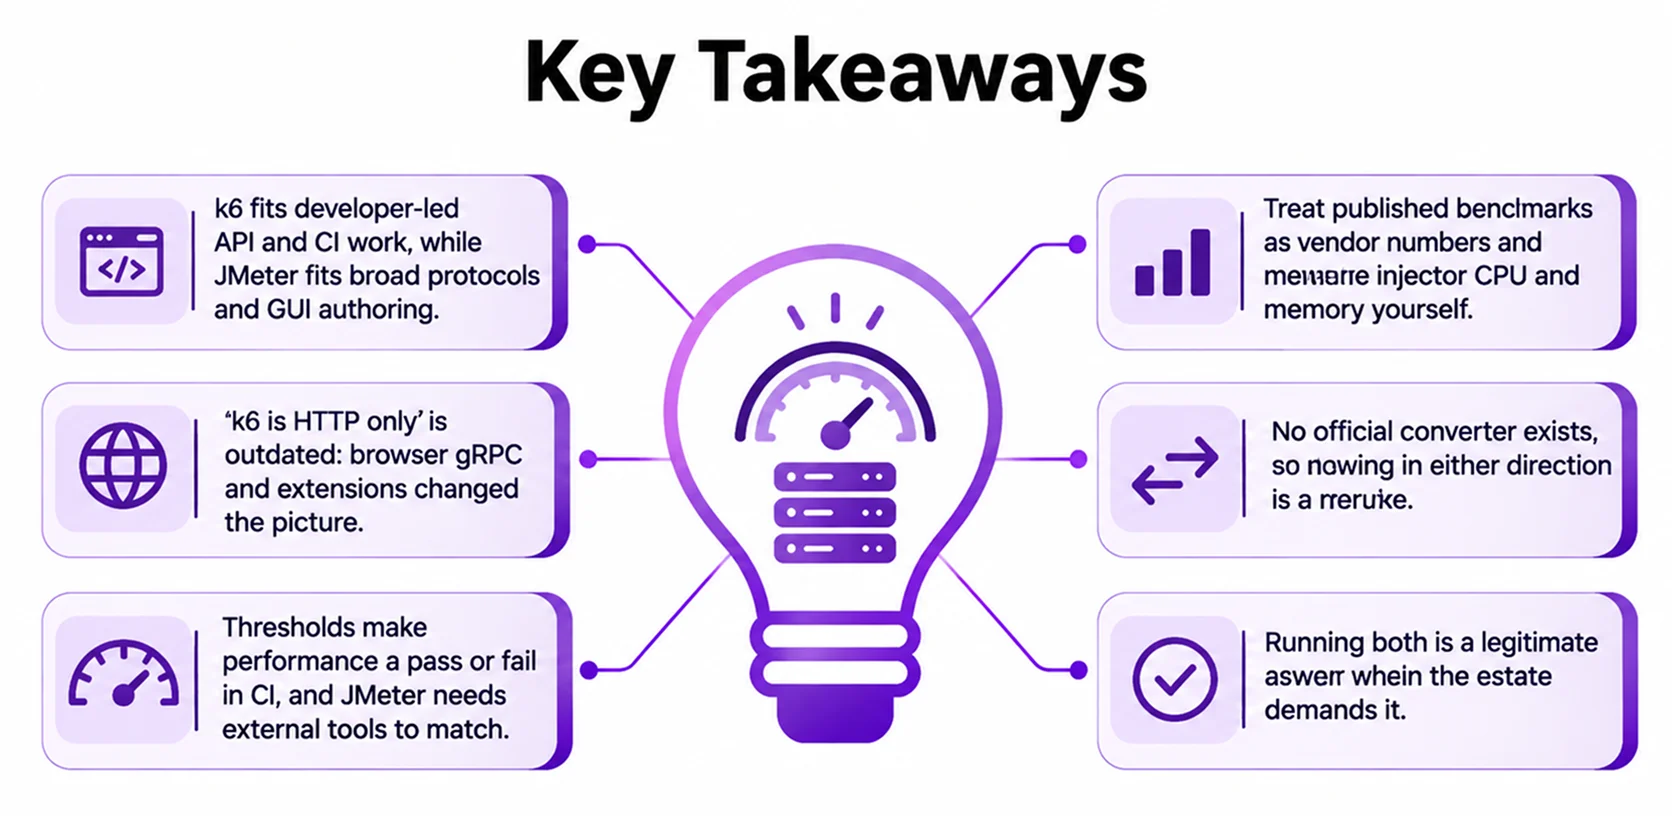
Tool choice follows team skills and protocol mix. If your engineers write code and ship through a pipeline, k6 load testing earns its place quickly, and if your estate speaks JDBC and message queues, JMeter still reaches protocols that k6 does not cover natively.
What matters most is whether anyone will still maintain the suite in twelve months, and whether your current plan can answer that honestly. Where the estate needs both, running both is a sound design, with each tool owning the part it handles best.
People Also Ask (FAQs)
Q1. What is the difference between load testing and stress testing?
Ans: Load testing checks behaviour at expected and peak traffic. Stress testing pushes past those limits to find the breaking point and see how the system recovers afterwards.
Q2. What does Azure Load Testing add to JMeter or k6 suites?
Ans: Azure Load Testing hosts the load generators, so you upload existing JMeter or k6 scripts and run them at scale without maintaining injectors, then compare runs in one place.
Q3. How does API testing differ from load testing?
Ans: API testing verifies correct endpoint responses, while load testing measures how endpoints behave under many concurrent users. Most teams build an API automation testing framework first, then add load.
Q4. How many concurrent users should a load test simulate?
Ans: A load test should simulate your real peak traffic, not a round number. Take the busiest hour from your analytics, add 20 to 50 percent headroom, and model that workload.
Q5. How often should we run load tests?
Ans: Run a small smoke-level load test on every pull request, a full scenario nightly or weekly, and a peak-traffic test before each major release or marketing campaign.