
Quality is no longer a secondary concern in software development - it is the defining factor behind customer trust, market adoption, and long-term product success. As web and mobile applications grow more complex, organizations must rely on QA metrics and KPIs to objectively measure testing success, improve user experience, and reduce business risk.
In 2026, modern software testing strategies are deeply integrated with automation, CI/CD pipelines, and AI-led test orchestration. At Frugal Testing, we work with global teams to build metrics-driven quality assurance processes that balance speed, cost efficiency, and software quality. This guide explains how to measure testing success using the most relevant QA testing KPIs, metrics, and benchmarks for the coming year.
Understanding QA Metrics and Key Performance Indicators in Software Testing
QA metrics and KPIs form the foundation of measurable quality. They transform testing from an activity into a predictable, controllable, and improvable process across the software development lifecycle.
Role of Quality Assurance Metrics in the Software Development Lifecycle
Quality assurance metrics provide visibility into how effectively testing activities support each phase of the software development lifecycle. From requirements analysis to user acceptance testing, metrics ensure that quality is built in - not inspected later.
Key roles played by QA metrics include:
- Measuring test effectiveness across development stages
- Identifying risk areas early through defect trends
- Improving collaboration between QA, DevOps, and development teams
- Supporting informed release decisions.
By tracking metrics like defect density, test execution rate, and covered requirements, teams can reduce escaped defects and improve time to market. Metrics also enable leadership to align testing outcomes with business goals such as cost efficiency and user satisfaction.
Difference Between Quality Metrics and QA Testing KPIs
Although often used interchangeably, quality metrics and QA KPIs serve different purposes. Metrics provide raw data, while KPIs highlight what truly matters for decision-making.
For example, test case effectiveness is a metric, while defect detection rate is a KPI. Mature QA teams track fewer KPIs but ensure they reflect real quality improvements rather than just volume.
Why QA Metrics Matter for Modern Web and Mobile Applications
Modern web and mobile applications must perform flawlessly across devices, networks, and cloud environments. QA metrics ensure consistency and reliability in these dynamic conditions.
QA metrics matter because they:
- Measure user experience across platforms
- Identify performance bottlenecks early
- Support scalability for cloud-based systems
- Reduce customer support volume post-release
In mobile applications, even minor defects can impact ratings and retention. Metrics such as application performance, error rates, and client-side performance help teams proactively protect user satisfaction and brand reputation.
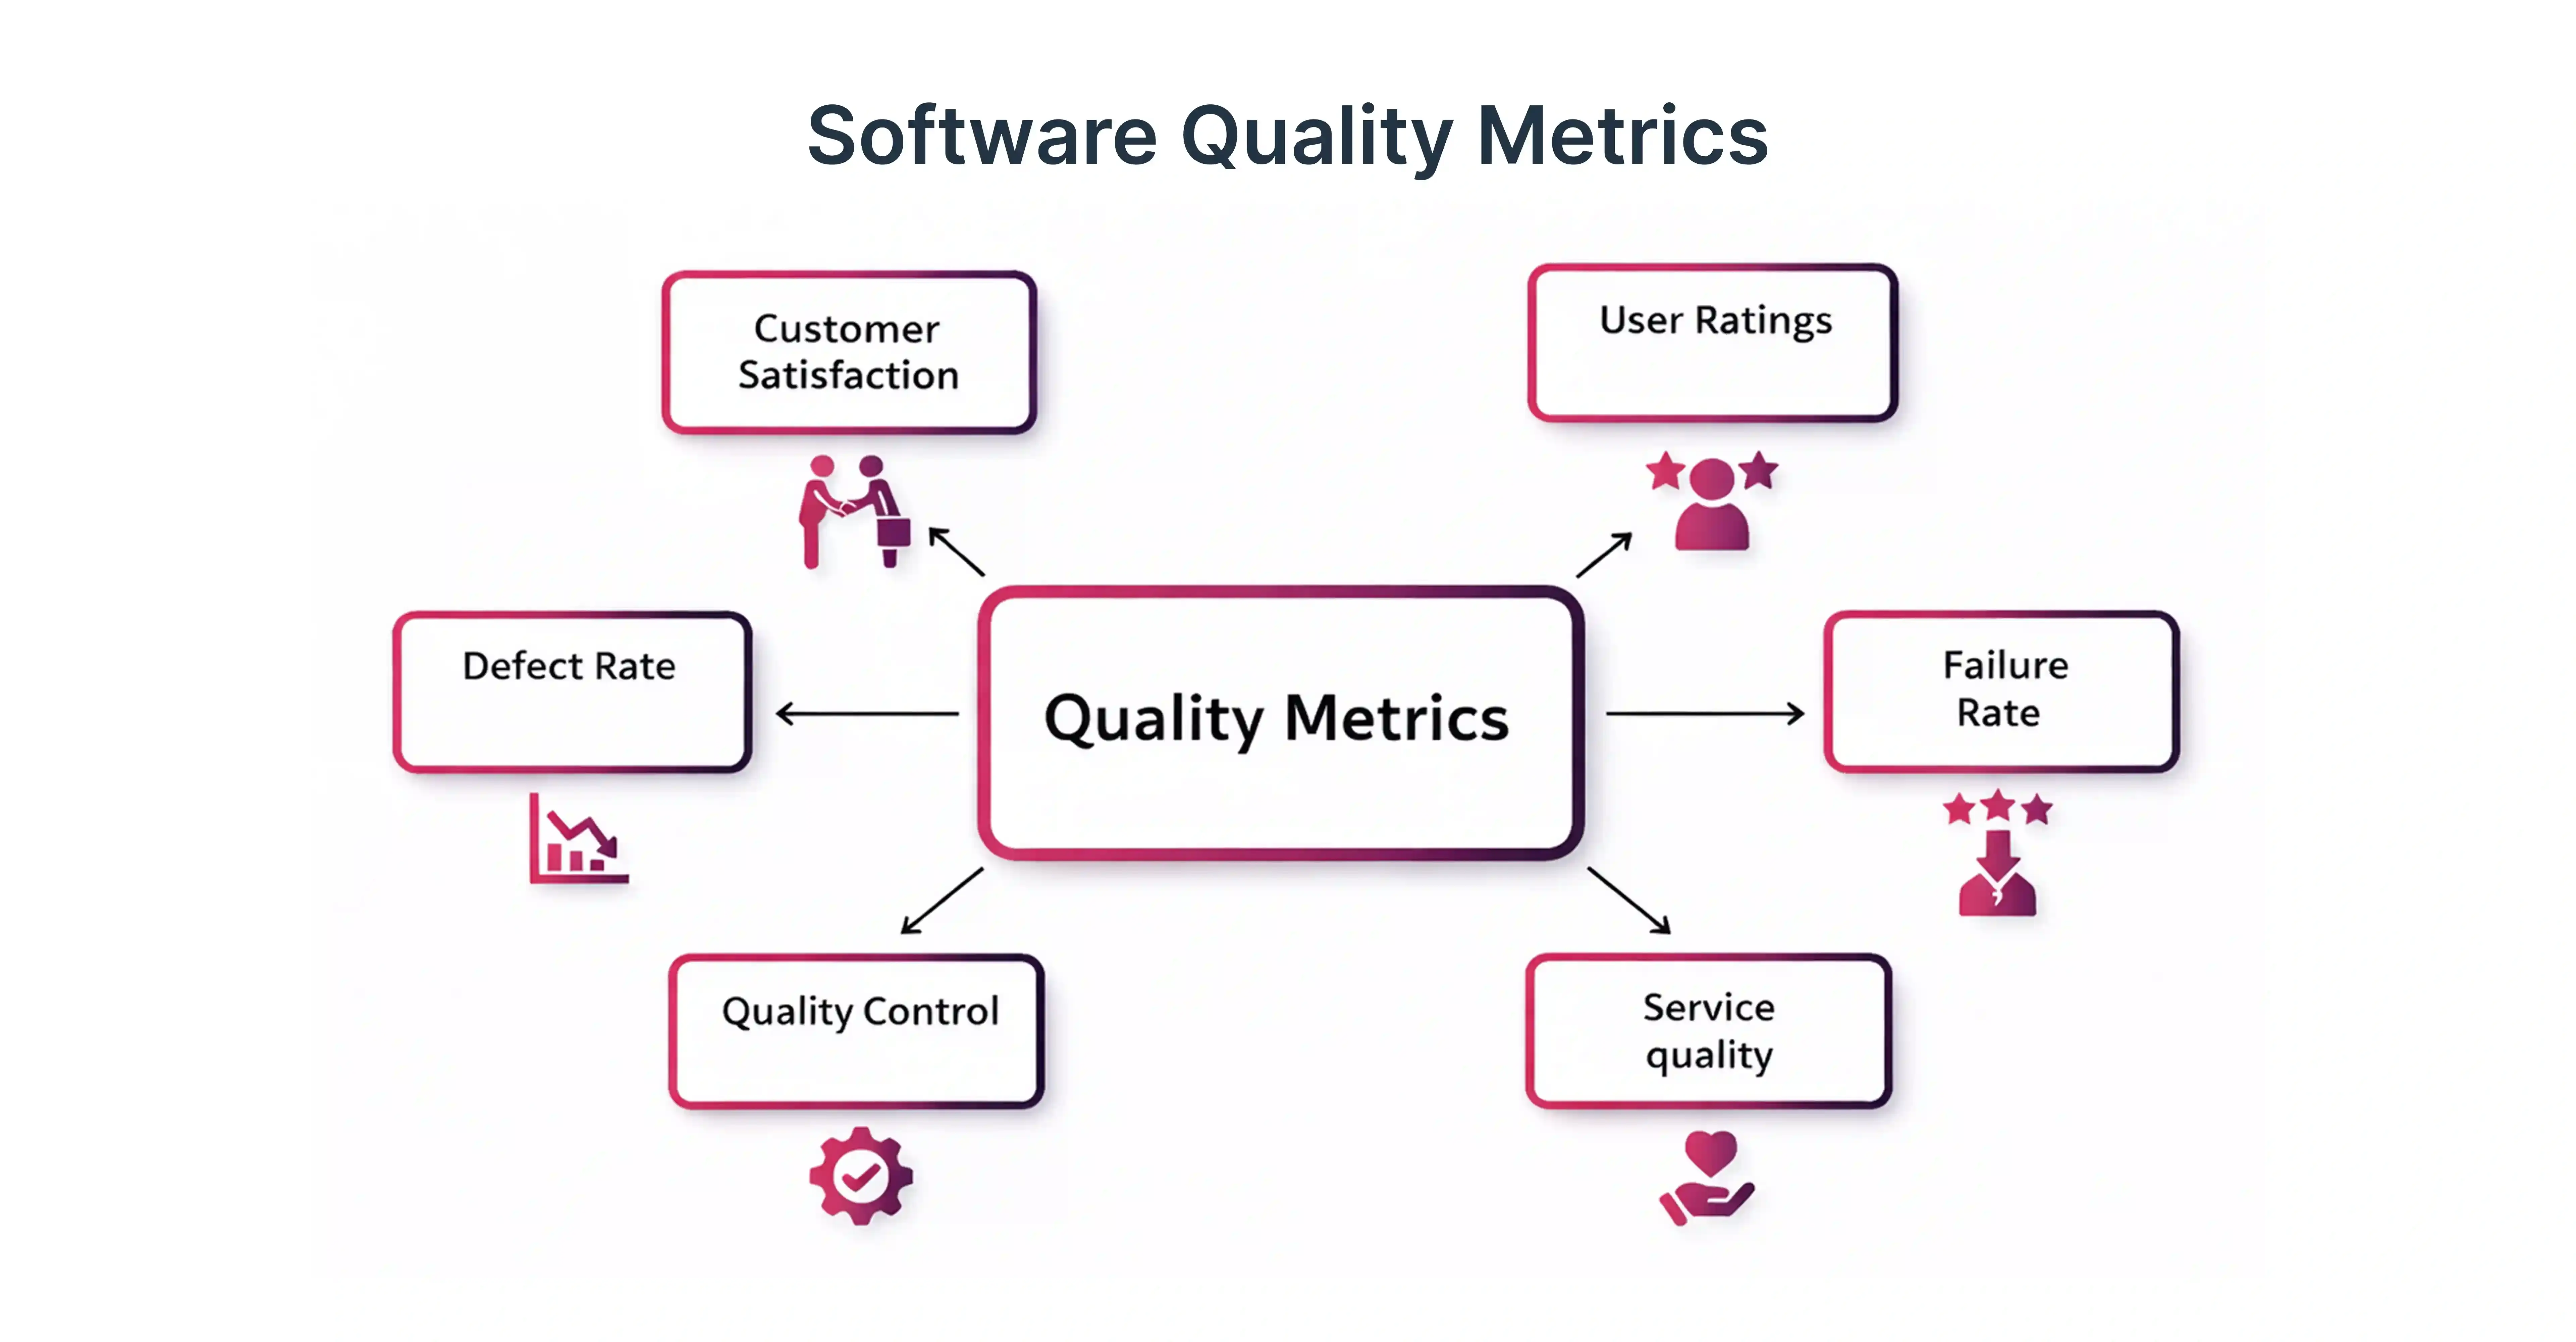
Defect-Centric Quality Metrics for Measuring Software Quality
Defect-based metrics remain central to evaluating software quality. They provide clear indicators of product stability and testing effectiveness.
Defect Density as a Core Software Testing Metric
Defect density measures the number of confirmed defects per unit of code, typically per thousand lines (KLOC). It is one of the most widely used software test metrics.
Defect density helps teams:
- Identify high-risk modules
- Compare quality across releases
- Evaluate code and test effectiveness
A lower defect density usually indicates better code quality and testing coverage. However, context matters - new features may naturally have higher defect density during early testing phases.
Defect Detection Rate and Defect Removal Efficiency
While defect density shows where issues exist, defect detection rate and defect removal efficiency (DRE) reveal how well teams catch and fix defects.
These metrics help teams:
- Measure QA effectiveness before release
- Reduce escaped defects into production
- Improve collaboration between QA and development
High DRE indicates that most defects are resolved before release, minimizing rework and customer-reported issues. In CI/CD pipelines, these metrics directly influence build success rate and release confidence.
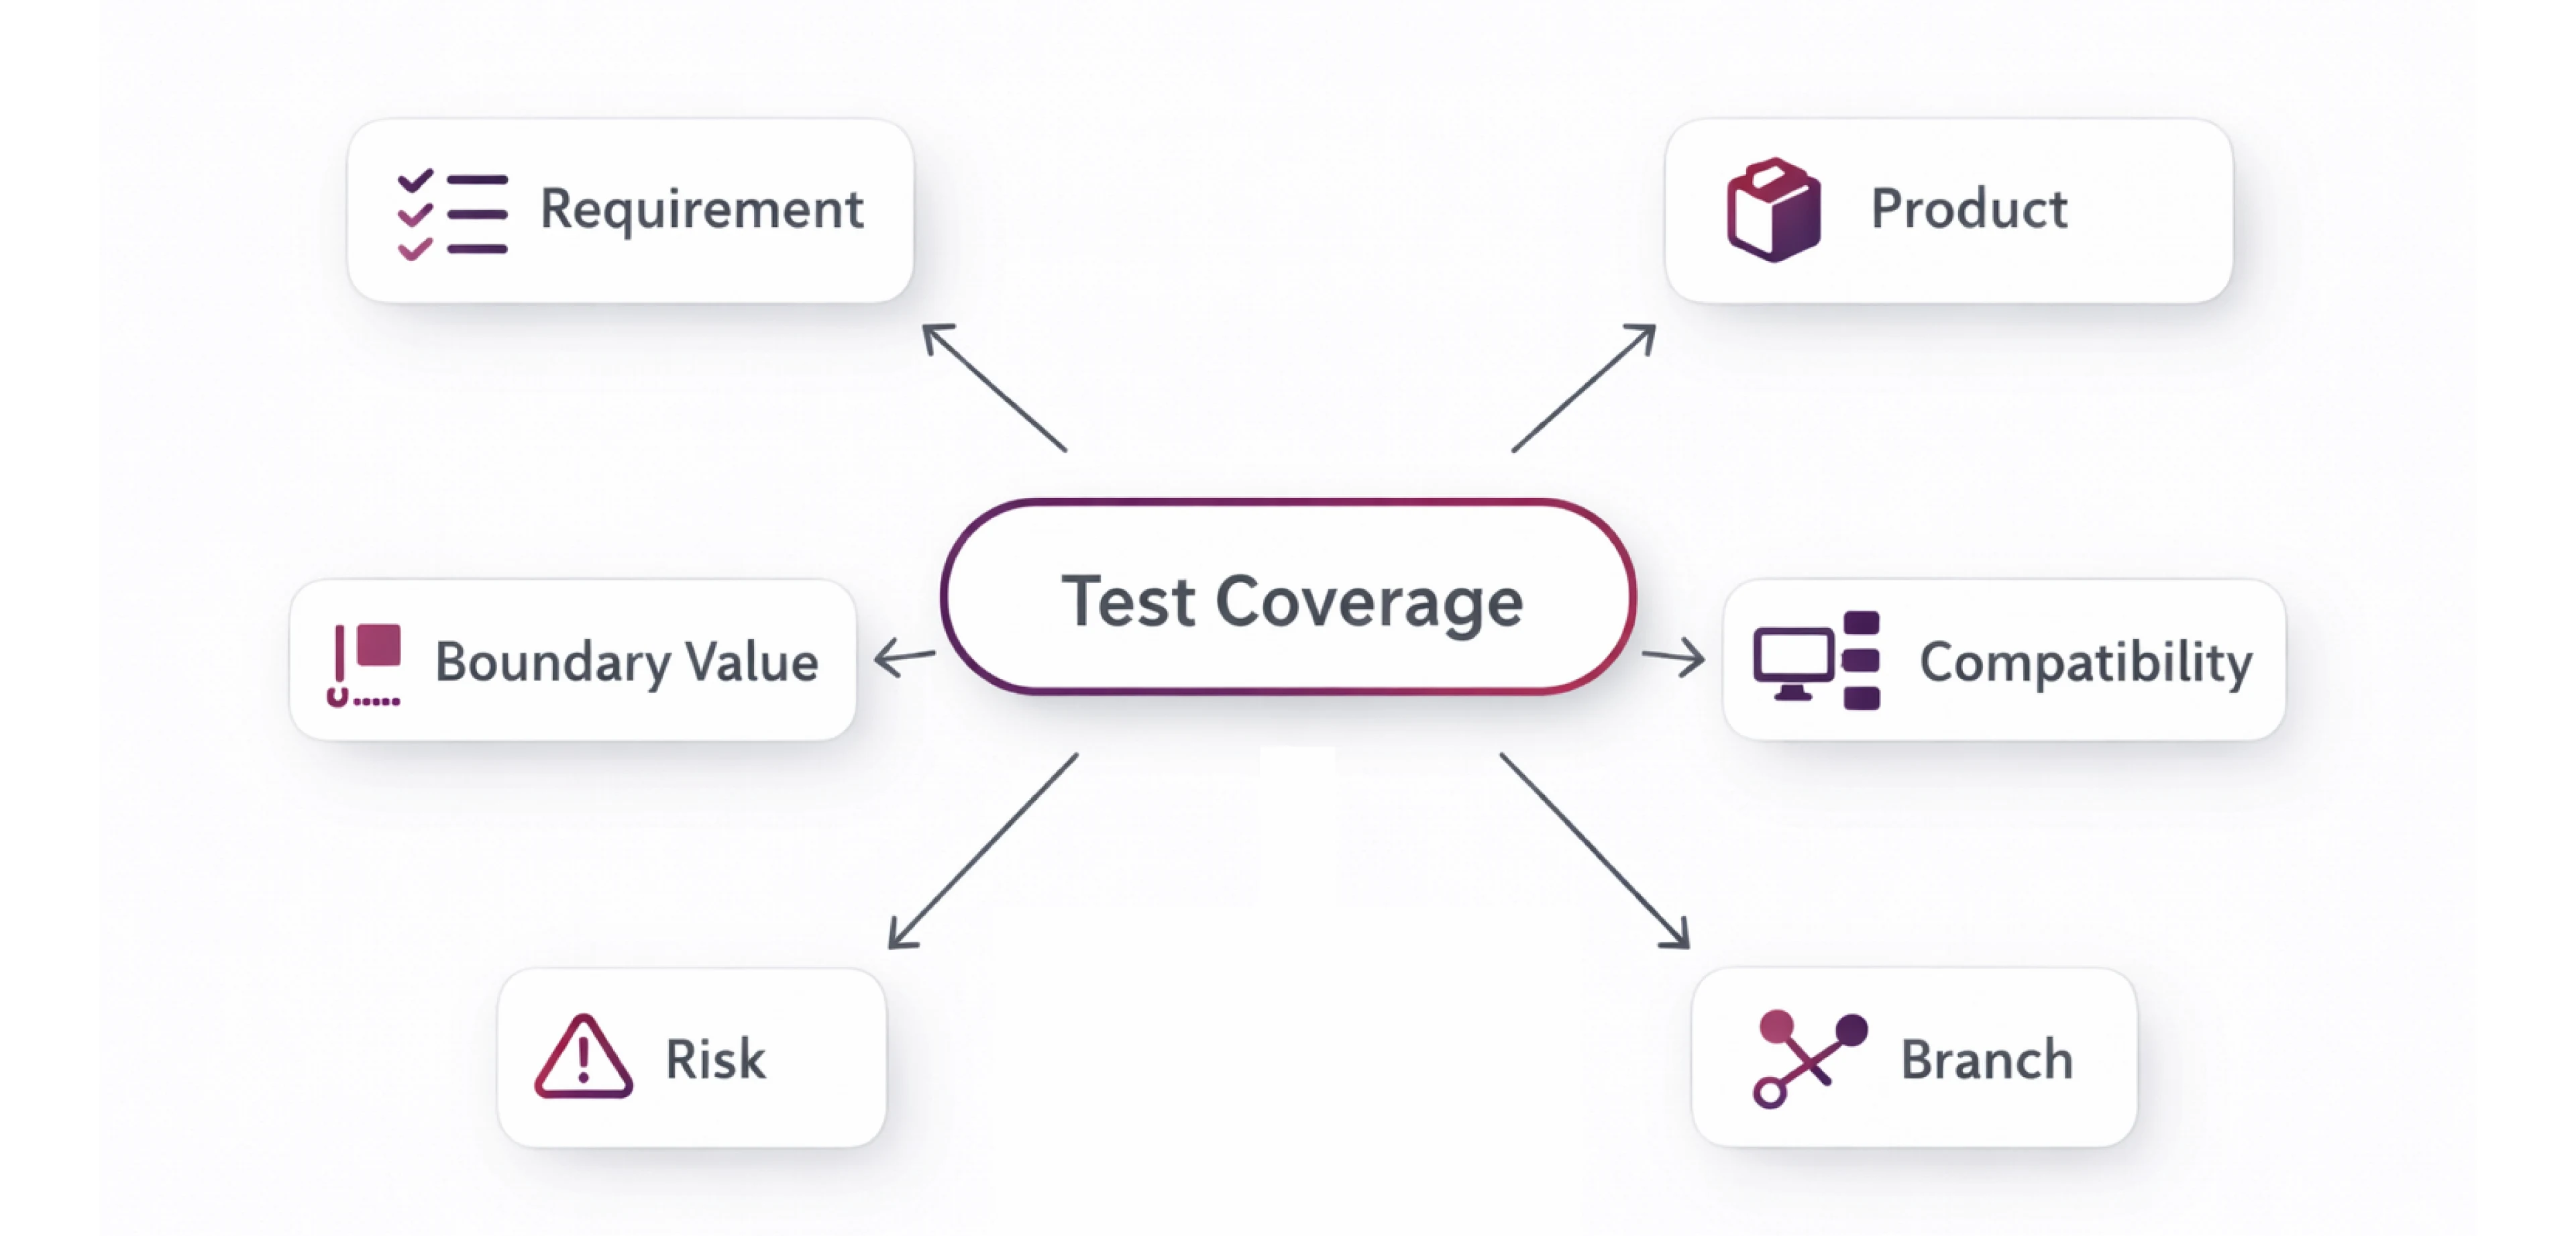
Test Coverage and Test Effectiveness Metrics in QA
Coverage metrics ensure that testing efforts align with system requirements and risk areas.
Test Coverage, Code Coverage, and Requirements Coverage
Test coverage measures how much of the application is tested, while code coverage evaluates which parts of the codebase are executed during testing.
Coverage metrics include:
- Functional test coverage
- Code coverage percentage
- Requirements coverage
Tracking requirements coverage ensures that all business needs are validated. Balanced coverage improves confidence without inflating test execution time or cost.
Test Case Effectiveness and Test Documentation Coverage
Test case effectiveness evaluates how well test cases identify defects. It reflects the quality - not quantity - of testing.
Key indicators include:
- Defects detected per test case
- Redundancy in test scenarios
- Alignment with real user flows
Test documentation coverage ensures test cases, scenarios, and results are clearly documented, supporting audit readiness and long-term maintainability.
Measuring Covered Requirements Using QA Metrics
Measuring covered requirements helps teams validate that testing aligns with stakeholder expectations.
This metric supports:
- Risk-based testing strategies
- Clear traceability from requirement to defect
- Improved release governance
In regulated industries, requirement coverage is often mandatory and directly linked to compliance and audit outcomes.
Test Execution, Stability, and Environment Availability Metrics
Execution and environment metrics ensure testing runs smoothly and predictably.
Test Execution Rate, Test Cycle Time, and Test Execution Efficiency
Test execution rate measures how many tests are executed over a given period, while test cycle time tracks the duration of a testing phase.
These metrics help teams:
- Optimize regression testing
- Improve CI/CD feedback loops
- Reduce release delays
Higher test execution efficiency indicates that tests deliver meaningful results without excessive rework or failures.
Test Environment Availability and Test Environment Stability
Even the best test cases fail without stable environments. Test environment availability measures uptime and readiness of test environments.
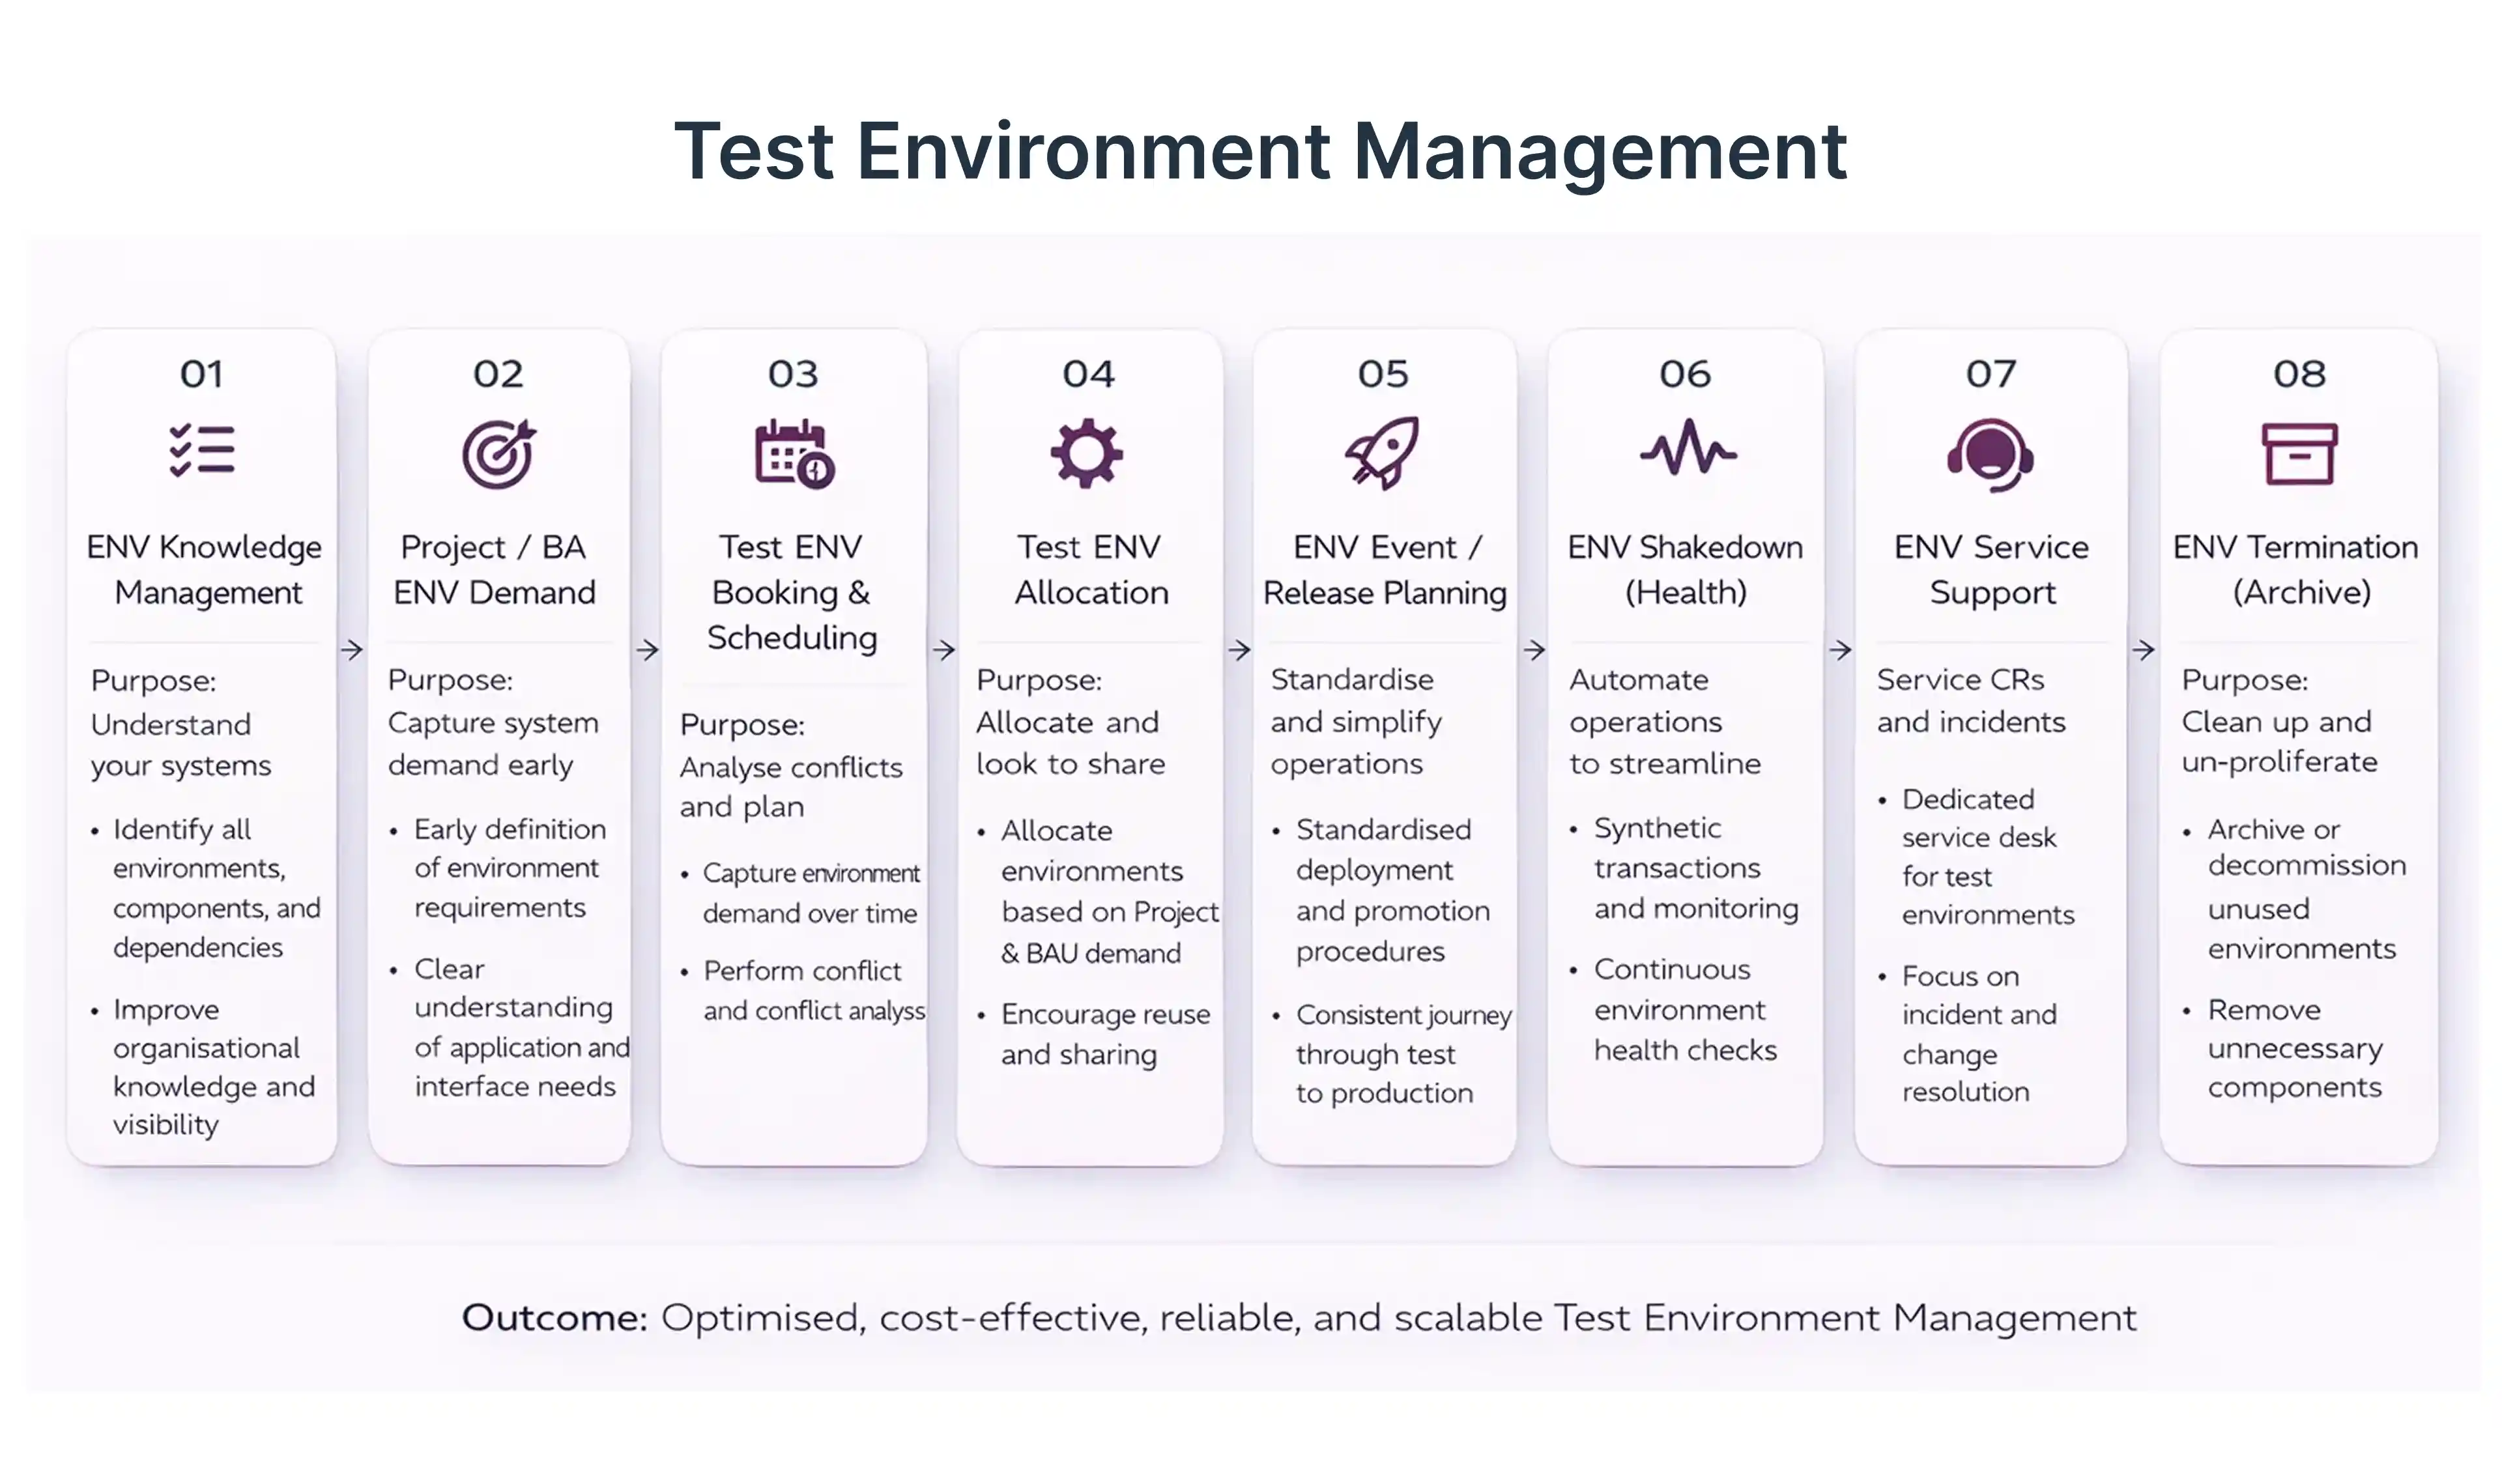
Benefits of tracking this metric include:
- Reduced blocked test cases
- Faster defect validation
- More reliable automation execution
Stable environments are especially critical for cloud and mobile testing, where configuration drift is common.
Build Success Rate and Feedback Loops in CI/CD Pipelines
Build success rate measures how often automated builds pass all quality checks. It is a key DevOps KPI.
Strong feedback loops enable:
- Faster defect detection
- Continuous quality improvement
- Reduced deployment risk
In high-performing teams, failed builds trigger immediate investigation rather than delayed fixes.
Test Automation Metrics and Automation Coverage in QA
Automation metrics determine whether test automation investments deliver real value.
Test Automation Coverage and Automation Stability Metrics
Test automation coverage measures the percentage of test cases automated. Automation stability tracks flaky or unreliable tests.
Effective automation metrics:
- Reduce manual testing effort
- Improve regression speed
- Increase confidence in releases
At Frugal Testing, we emphasize stable, maintainable automation over high but unreliable coverage.
Automated Tests, Authored Tests, and Automation Capabilities
Tracking authored tests versus executed automated tests helps assess automation maturity.
Key insights include:
- Automation capabilities of the framework
- ROI of automation services
- Scalability of automation contracts
Low-code automation platforms are increasingly used to improve productivity and reduce dependency on specialized skills.
Performance Testing and Application Performance KPIs
Performance is a key determinant of user satisfaction and business success.
Performance Testing Metrics for Application and Cloud Performance
Performance testing metrics measure responsiveness, scalability, and stability under load.
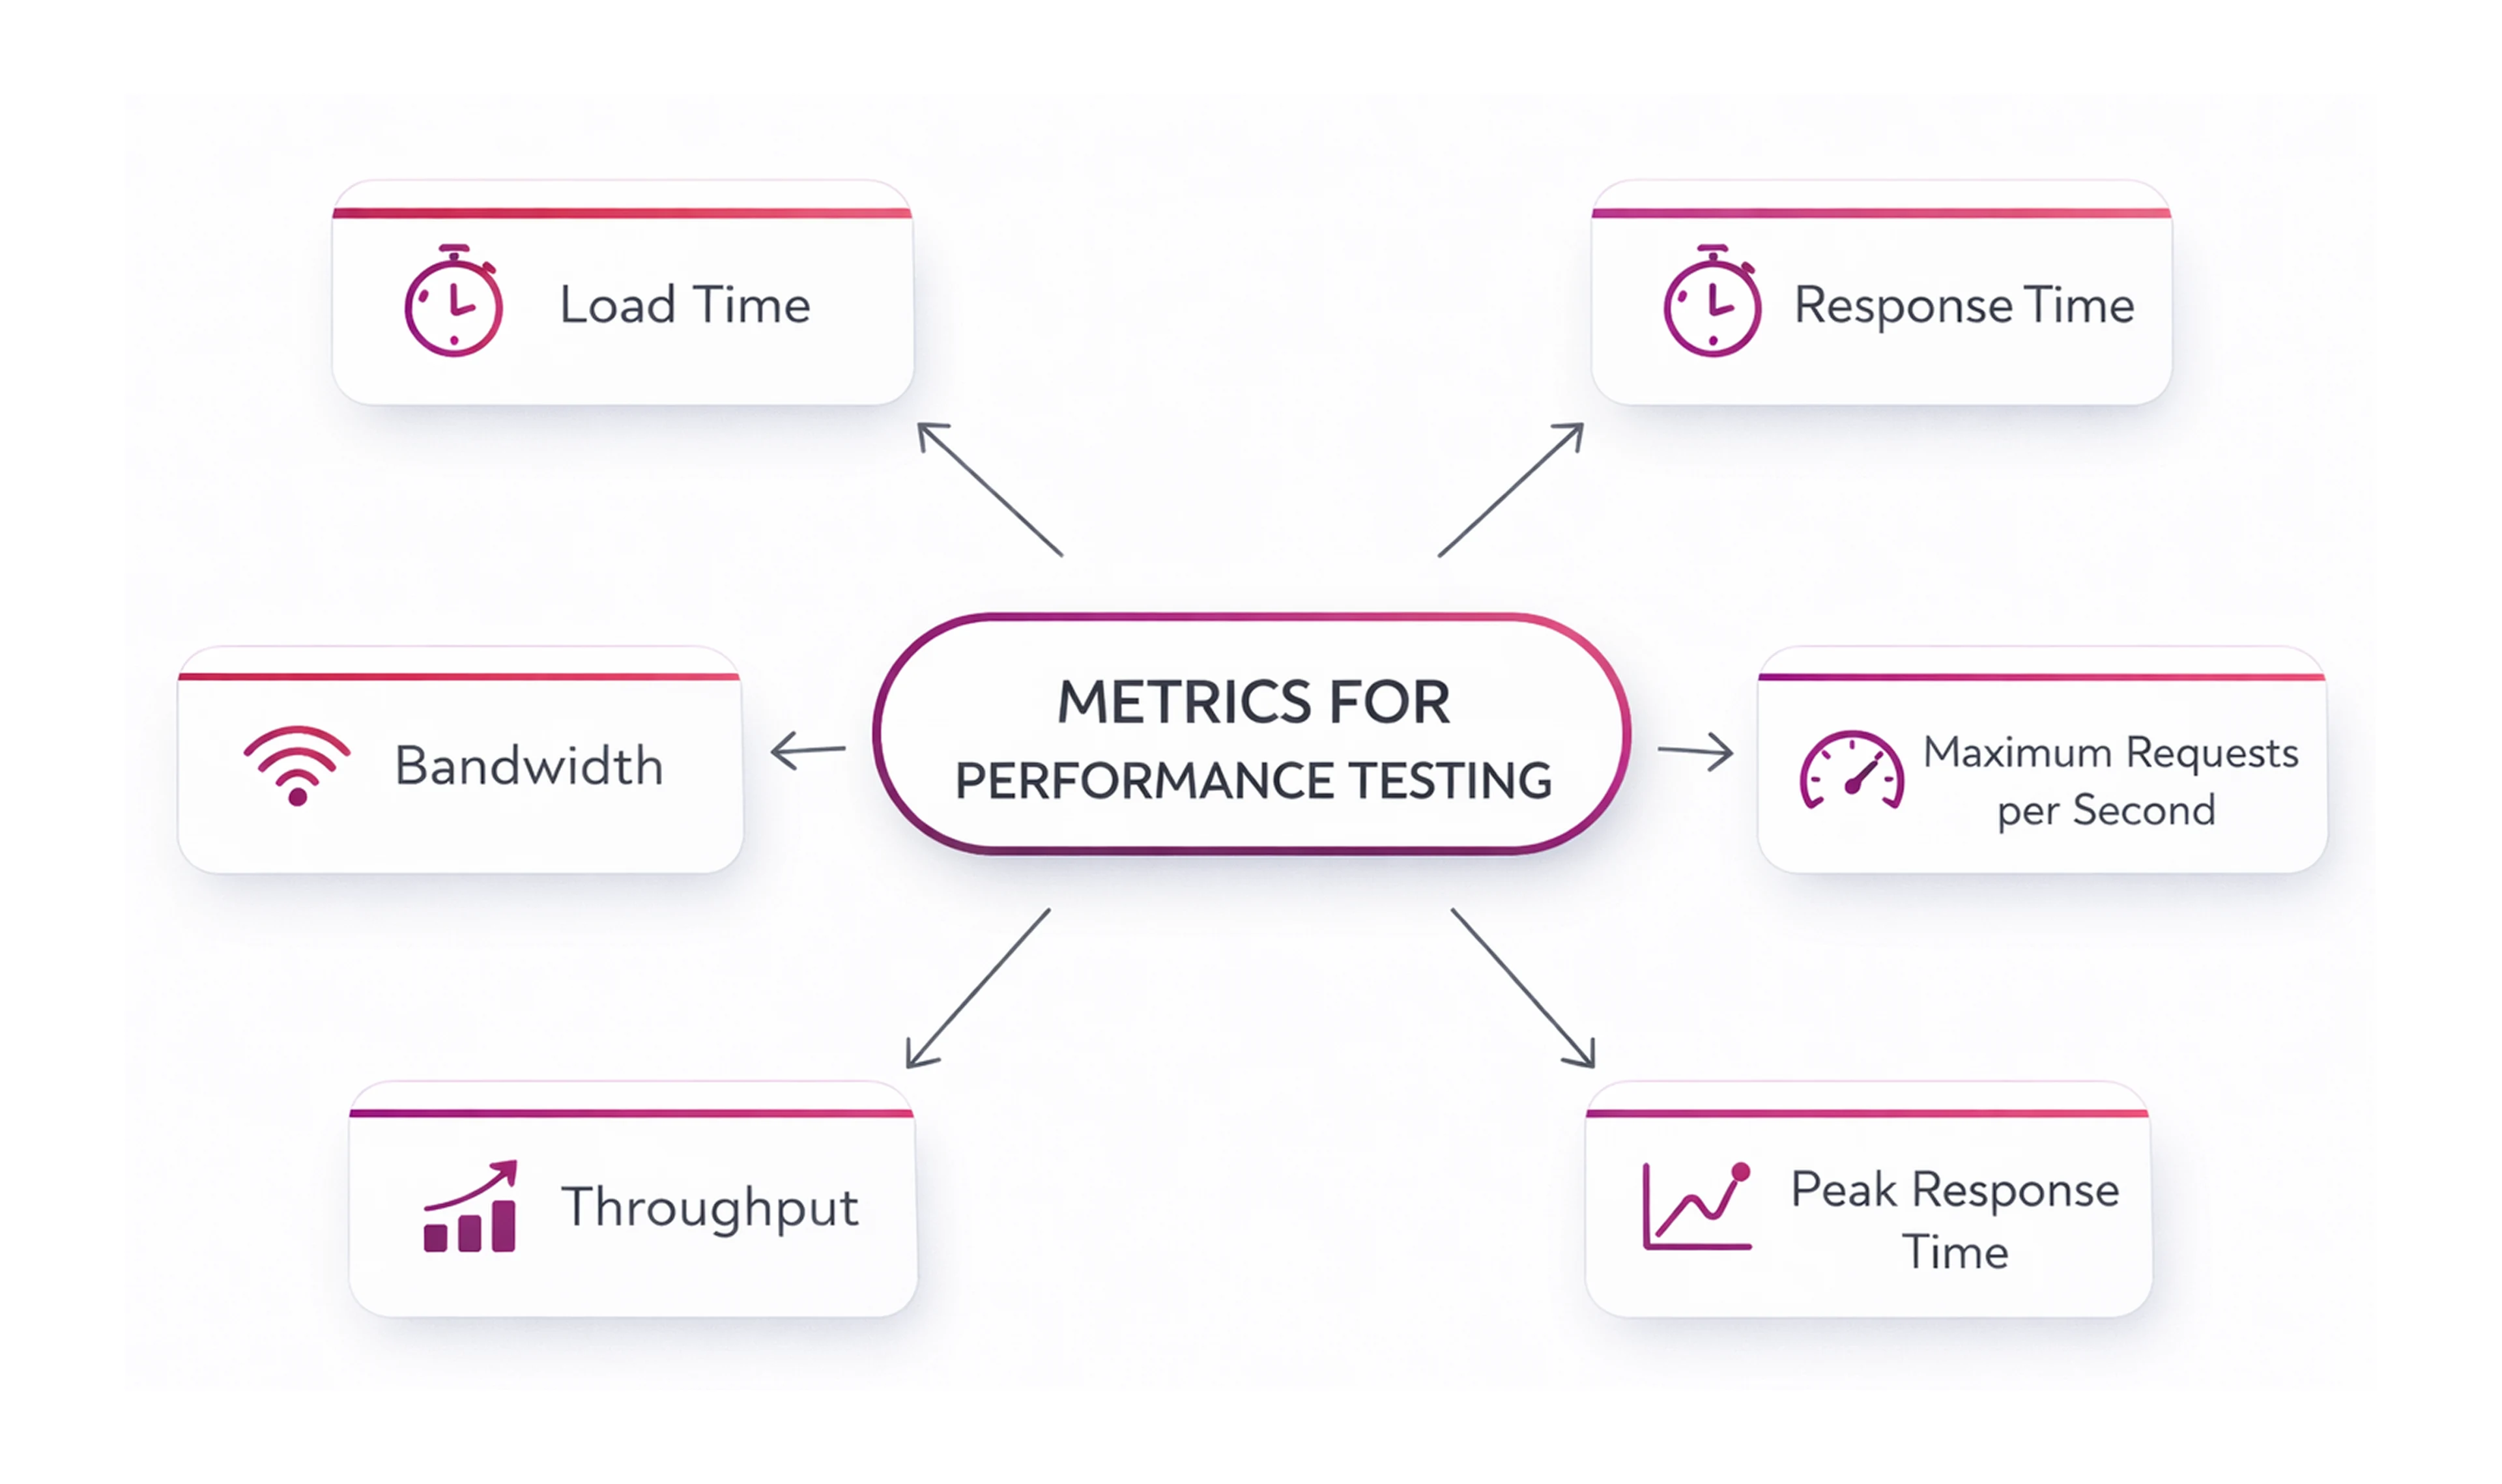
Common KPIs include:
- Response times
- Throughput
- Resource utilization
Cloud performance metrics help teams ensure consistent experiences across regions and traffic spikes.
Measuring Client-Side Performance, Server Performance, and Error Rates
Client-side performance focuses on browser and device responsiveness, while server performance evaluates backend stability.
Key metrics tracked:
- Error rates
- API response latency
- Crash frequency
These KPIs directly influence user experience, retention, and conversion rates.
AI-Based Performance Testing and Real-Time Quality Monitoring
AI-based performance testing enables predictive analytics and real-time quality monitoring.
Benefits include:
- Early detection of performance degradation
- Automated root cause analysis
- Continuous optimization
AI-led test orchestration is becoming standard for large-scale applications in 2026.
Agile, DevOps, and Shift-Left QA Metrics for Faster Releases
Modern teams integrate QA early to reduce risk and accelerate delivery.
Shift-Left Testing Metrics Across the Development Lifecycle
Shift-left testing focuses on early validation of requirements and code.
Key metrics include:
- Defects found before coding
- Test coverage during development
- Early feedback effectiveness
Shift-left strategies significantly reduce cost of fixing defects later.
Mean Time to Detect, Mean Time to Fix, and Mean Time to Repair
These time-based KPIs measure responsiveness to quality issues.
They help teams:
- Improve operational efficiency
- Reduce downtime
- Enhance customer trust
Lower mean time to detect and mean time to repair indicate a mature QA and DevOps process.
Continuous Process Improvement Using Predictive Analytics
Predictive analytics transforms historical QA data into actionable insights.
Teams use analytics to:
- Forecast defect trends
- Optimize test prioritization
- Improve continuous process efficiency
This approach supports proactive quality management rather than reactive fixes.
Measuring QA Maturity and Readiness for 2026
QA maturity reflects how well testing supports business growth.
QA in 2025 and the Evolution of Software QA Testing
QA in 2025 marked a shift toward quality engineering, automation-first approaches, and AI integration.
Key changes include:
- Increased automation coverage
- Data-driven decision-making
- Closer alignment with business KPIs
Organizations entering 2026 must adopt scalable QA models to remain competitive.
Automation Services, Automation Contracts, and QA Scalability
Scalable QA relies on flexible automation services and outcome-based automation contracts.
Benefits include:
- Predictable cost structures
- Faster onboarding of new projects
- Support for on-demand QA
Frugal Testing helps organizations scale QA without increasing fixed overhead or compromising quality.
Conclusion: Final Thoughts on QA Metrics and KPIs for Testing Success
Building a Metrics-Driven Quality Assurance Process
A metrics-driven QA process enables visibility, accountability, and continuous improvement.
Effective programs:
- Track meaningful KPIs
- Align QA with business goals
- Adapt to evolving technologies
Metrics should guide decisions - not become vanity numbers.
Using QA Metrics to Improve Software Testing Strategies
When used correctly, QA metrics improve software testing strategies, reduce risk, and enhance user satisfaction.
By combining automation, performance testing, predictive analytics, and shift-left practices, teams can confidently measure and achieve testing success in 2026.
At Frugal Testing, we believe quality is measurable - and when measured well, it becomes a competitive.
People also ask for(FAQ’s)
Q1: What are QA metrics and KPIs?
Ans: QA metrics and KPIs are measurable values used to evaluate the quality, efficiency, and effectiveness of software testing. Metrics track testing data, while KPIs measure progress toward quality and business goals.
Q2: Why are QA metrics important in software testing?
Ans: QA metrics help teams monitor testing progress, identify quality gaps early, and improve decision-making. They ensure testing efforts align with release timelines and customer expectations.
Q3: What are the most important QA KPIs in 2026?
Ans: Key QA KPIs in 2026 include defect leakage rate, test coverage, defect removal efficiency, automation coverage, and mean time to detect defects. These KPIs support faster releases and higher software quality.
Q4: How do you measure testing success using QA metrics?
Ans: Testing success is measured by analyzing metrics such as defect density, test case effectiveness, test execution coverage, and post-release defects. Together, these indicators show quality, efficiency, and release readiness
Q5: What is the difference between QA metrics and QA KPIs?
Ans: QA metrics provide detailed data about testing activities, while QA KPIs focus on high-impact indicators that reflect testing success. KPIs are goal-driven and aligned with business outcomes.