The code committed to the production process is the pulse of software delivery in today's world. This output requires more than just automation; it requires observability throughout the process. Seeing everything that occurs in your CI/CD pipeline allows teams to identify problems sooner and to produce a better quality product with few or no failures upon delivery.
At Frugal Testing, we believe that achieving true DevOps efficiency requires clear, quantifiable, and intelligent pipelines. By combining DevOps Solutions with smart observability practices, this guide will walk you through the critical steps to implement New Relic into your continuous integration and continuous delivery (CICD) efforts, converting telemetry data into actionable information.
✨ Key Insights from This Article:
⚙️ How integrating New Relic into DevOps pipelines accelerates delivery and boosts reliability
🔁 Automation of performance gates to ensure only high-quality builds get deployed
🌐 Unified observability across applications, infrastructure, cloud, and serverless environments
🛡️ Enhanced cloud-native security and compliance with real-time risk detection
📊 Data-driven insights that reduce MTTR and improve end-user experience in production
DevOps Pipelines, CI/CD & Why Observability Matters with New Relic
Rapid iteration and dependable operation dominate today's fast-paced Software Development Lifecycle (SDLC). The DevOps CI/CD pipelines (Jenkins, GitLab CI/CD, Azure DevOps, or GitHub Actions) are the means that allow for rapid iteration through automated deployment processes; however, without proper visibility into these deployments, increased speed for these types of deployments is a risk.
To mitigate this risk, Observability Solutions like New Relic deliver superior observability with much more than just monitoring, but also include actionable insights for both application and infrastructure.

What You Will Learn: Integrating New Relic into Your Pipeline
This guide transitions you from understanding why observability matters to mastering how to implement it:
- Automate deployment markers for accurate change tracking.
- Set performance and health gates to automatically pass/fail builds using real-time telemetry.
- Integrate security checks for a secure, compliant pipeline.
- Transform your CI/CD pipeline into an intelligent, self-validating system.
By following these steps, teams move from reactive troubleshooting to proactive optimization, ensuring scalable, high-quality software delivery.
Why New Relic in DevOps Pipelines Matters
While one purpose of DevOps is to eliminate barriers (or silos) between teams that develop and manage software systems, many times the final release fails to perform as intended. New Relic Application Performance Monitoring (APM) unifies all aspects of the DevOps workflow by providing one shared view of application and infrastructure performance as well as deployment events.
New Relic APM allows users to connect problems to either specific commits or infrastructure changes. This significantly reduces the number of steps required for a resolution and allows software teams to release new software much faster and with greater confidence than before.
Benefits of New Relic: Observability, Faster MTTR & Proactive Security
By consolidating metrics, logs, traces, and events, New Relic empowers teams with comprehensive observability. Correlating performance data with deployment events lowers time-to-resolution. Integrated security insights help prevent issues before they affect production.
These capabilities support Cloud-Native Solutions, enabling teams to proactively manage performance, maintain compliance, and ensure faster, safer deployments.
- Observability: Complete visibility into system performance, infrastructure health, and user experience.
- Faster MTTR: Automatically correlates performance degradation with deployment markers, reducing diagnostic time.
- Proactive Security: Detects vulnerabilities early, allowing teams to address issues before they reach production.
These capabilities enable teams to proactively manage performance, maintain compliance, and ensure faster, safer deployments. Observability becomes useful instead of just informative.
Prerequisites for New Relic Integration
A correct setup and security policy, alongside a correctly configured agent, enable your pipeline to pull data from New Relic reliably, as it provides a secure platform to do so. Establishing this foundation allows you to achieve consistent, actionable insights from New Relic's telemetry data - a critical requirement for Automation Solutions to operate successfully.

Account, API Keys & Agent Setup
The first steps towards successfully connecting New Relic to your CI/CD pipeline are correctly configuring access to a New Relic account, controlling access to API keys, and correctly installing the appropriate New Relic agent for your CI/CD environment. These will provide a smoother transition of information from your CI/CD pipeline to New Relic.
- New Relic Account: Requires Admin or Contributor permissions.
- API Keys: Use ingest and REST API keys, securely stored as CI/CD secrets.
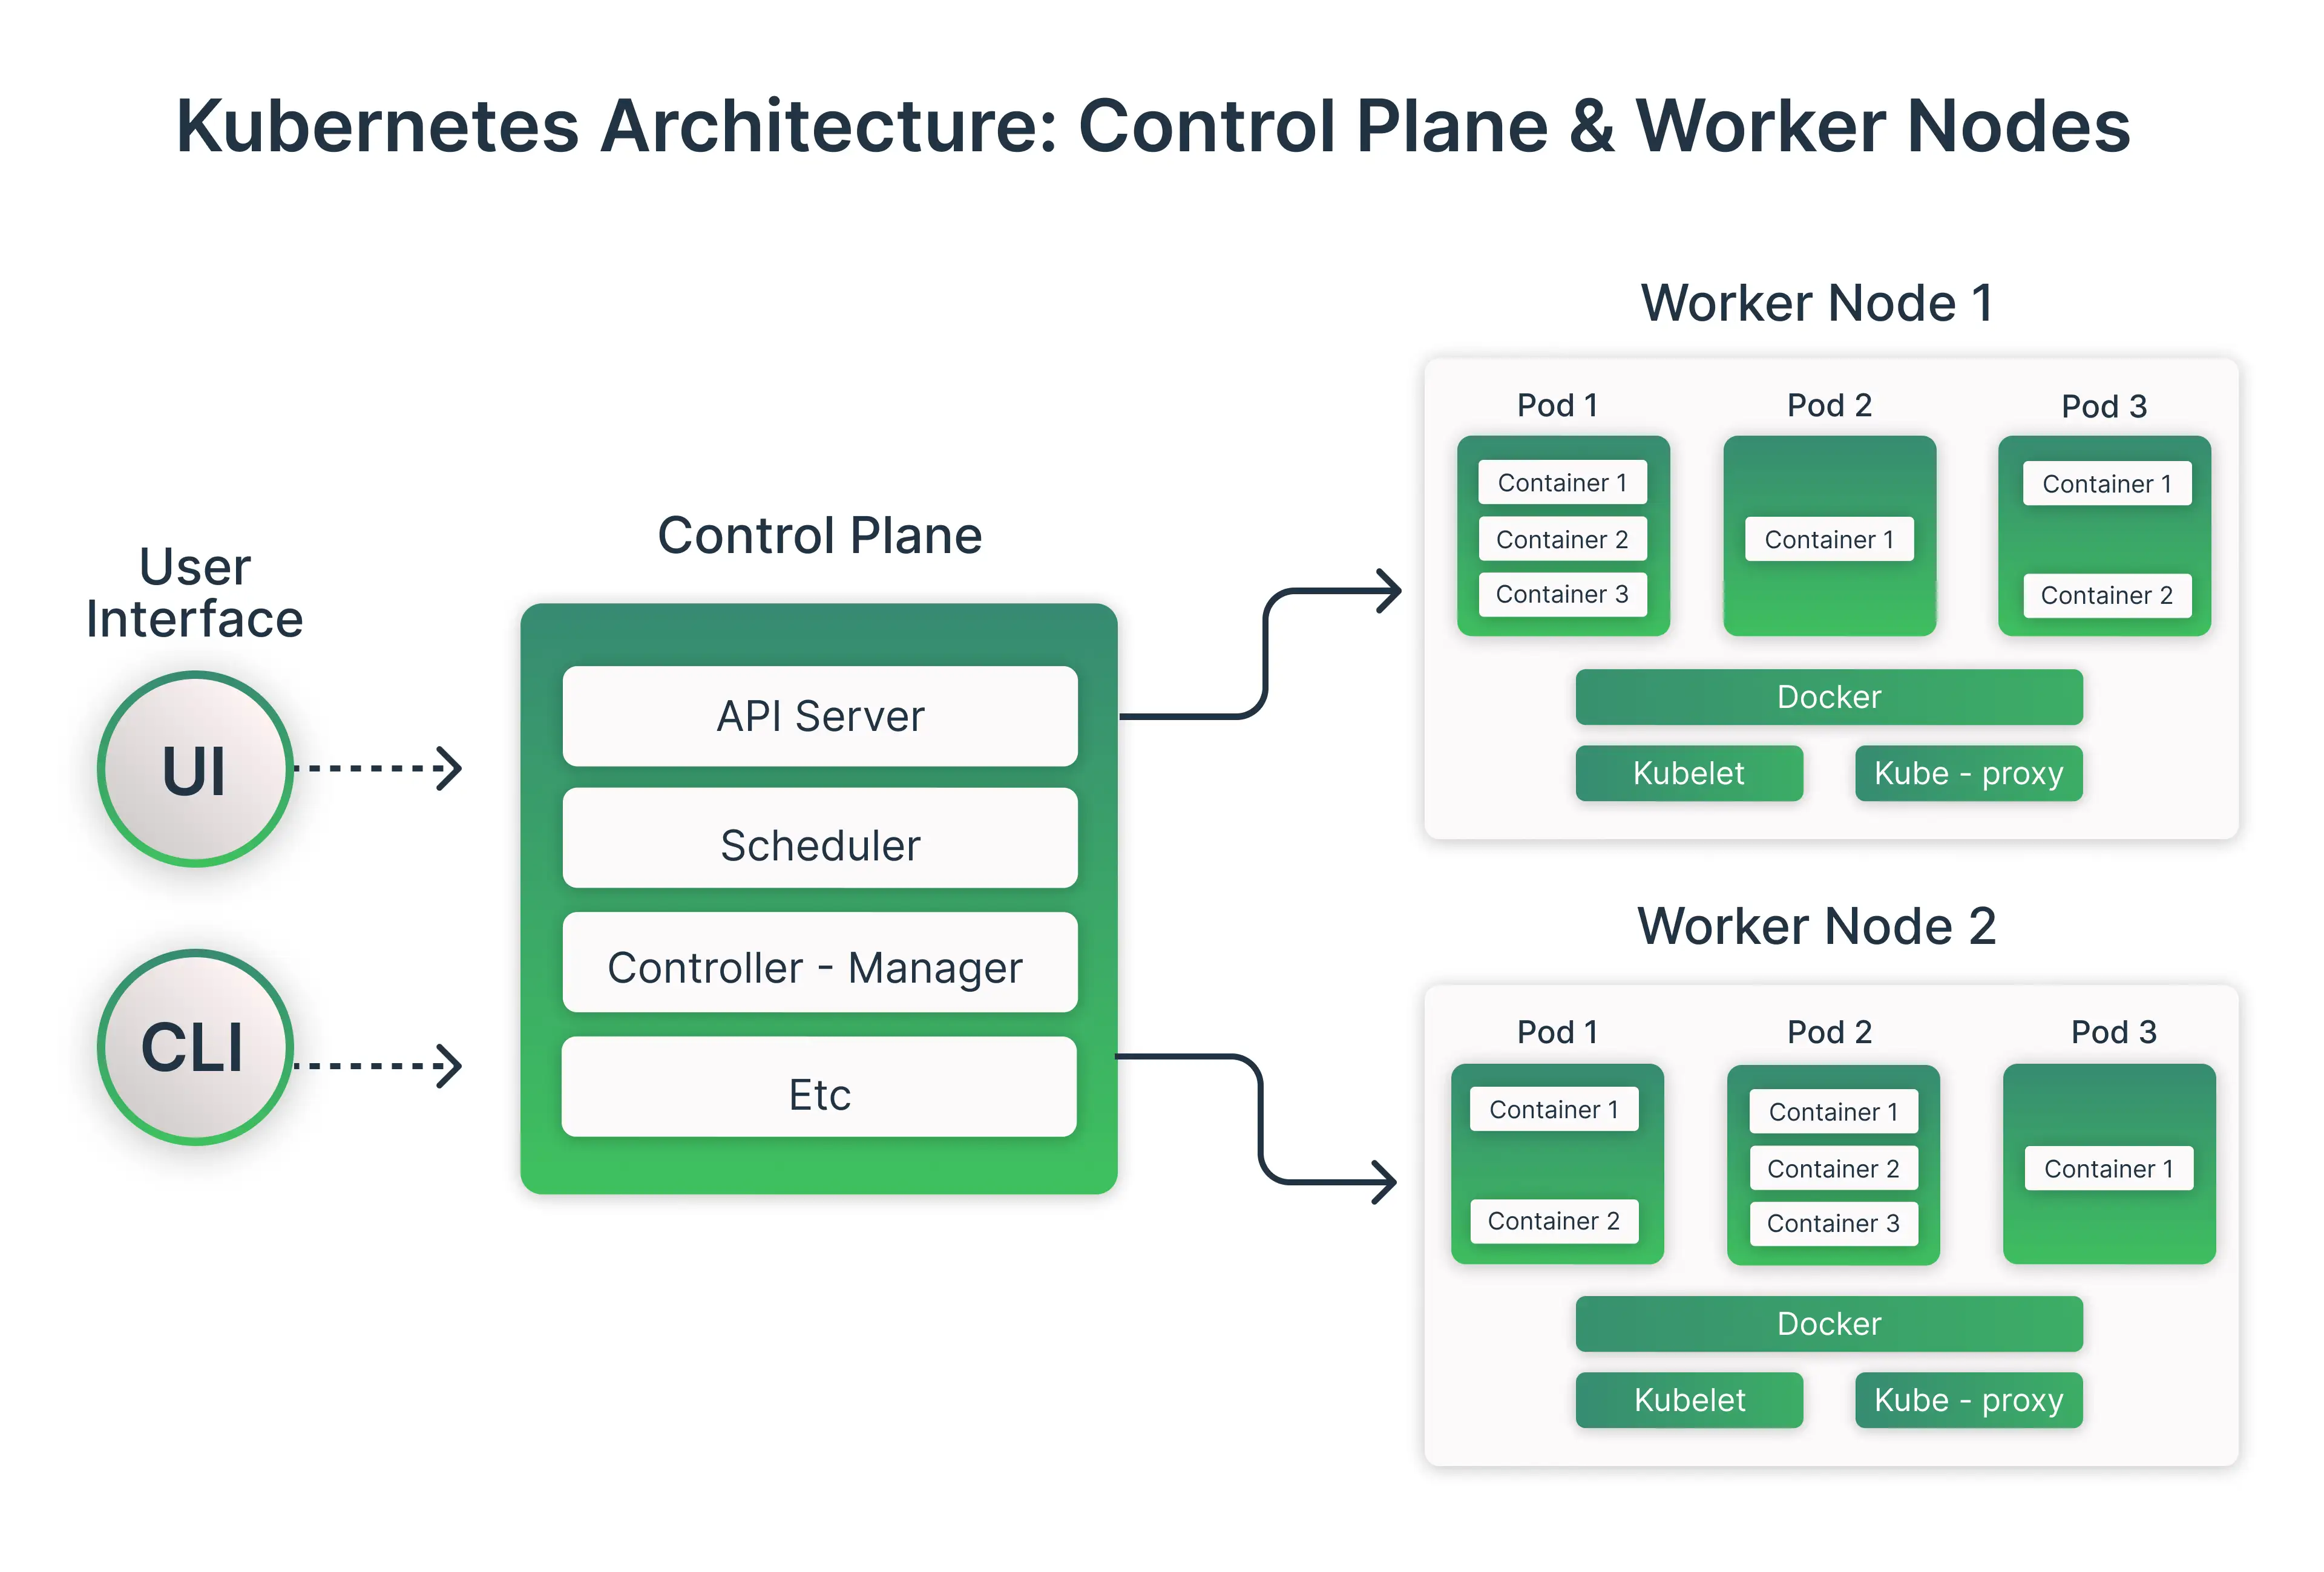
- Agent Setup: Install relevant agents (APM, Infrastructure) in the build or deployment environment, including Kubernetes or Docker setups.
The ability to gather trustworthy and accurate data due to these preparations will allow for automated monitoring and observability to occur. Therefore, as the first step, teams should feel confident knowing the metrics, logs, traces, and events have all been correctly collected.
Core Telemetry Types: Metrics, Logs, Traces & Events
The centralized observability platform of New Relic provides strength by integrating logs, metrics, events, and traces into a single, cohesive view of all four data types. Each type of data can provide a unique perspective into various aspects of how the system works, including system performance and deployment information.
- Metrics: Time-series data like CPU usage, throughput, and latency.
- Logs: Contextual application activity for debugging.
- Traces: Follow requests across distributed microservices.
- Events: Deployment markers and lifecycle moments for correlation.

By gathering all of these different telemetry types together, companies can create the needed context for transforming their raw data into valuable insights. Therefore, companies will be able to create better observability and make better decisions when looking at their deployment pipeline.
Step 1 - Automating Deployment Markers
Automated Deployment Markers link every code change to the relevant performance data. After deployment, the performance data is available faster by eliminating the need to manually correlate the code change to performance data, reducing errors, and speeding up the ability to analyze system performance. Therefore, building automated deployment markers is a key component of proactive pipeline monitoring.
Change Tracking & Automation Methods
Using the New Relic command line interface (CLI), cURL, or CI/CD environment variables, you can automatically track deployment events created within your deployment pipelines. By using custom integrations to store additional information (e.g., DORA metrics), you can obtain greater insight into the performance of your deployment pipelines.
- New Relic CLI or cURL: Send deployment events immediately after a successful build.
- CI/CD Variables: Automatically inject commit SHA, build number, and contributor information.
- Custom Integration: Use scripts or enhanced payloads with metadata such as DORA metrics.
Automatic deployment markers simplify the process of tracking and verifying release performance. Within an hour or two after each deployment, teams receive immediate action items, which lay the groundwork for creating reliable and observability-oriented CI/CD pipelines.
Step 2 - Performance & Health Gates in CI/CD
Maintaining the reliability of your CI/CD pipeline by establishing performance and health gates is essential. Your team will have the ability to reduce risk and identify problems before deployment by monitoring SLO adherence before deployment. The observability tools' real-time verification that the software being deployed meets performance metrics enables teams to do so repeatedly each time they deploy.
Alerts + Dashboards for Real-Time Validation
Monitoring performance metrics and health checks provides immediate feedback on system stability. Alerts linked to dashboards or distributed traces allow teams to act quickly and maintain CI/CD quality.
- Performance Metrics: Validate P95 latency, error rates, and throughput.
- Health Checks: Ensure CPU, memory, and disk I/O remain within safe thresholds.
- Alerting: Fail CI/CD jobs automatically when thresholds are breached, linking directly to dashboards or distributed traces.
Failing jobs automatically when thresholds are breached reinforces the “fail fast” principle. Teams can identify regressions immediately, preventing flawed deployments from reaching production.
Step 3 - Security Observability in Your Pipeline
DevOps Pipeline Security Should Not Be an Afterthought, but an Integral Part of the Process. Continuous Security Observability Provides Security Teams with a Complete View of the Application Lifecycle, Allows Security Teams to Discover Vulnerabilities Earlier, and Identify Security Compliance Concerns Earlier; thus, it Supports Organisations in achieving DevSecOps Goals. Proactive Security Monitoring Provides Application Protection for Both Customers and Applications While Maintaining Speed of Deployment.
Security Scanning + Compliance Monitoring
Vulnerability scanning and compliance checks enable teams to detect risks before they impact production. Tools like Snyk, Trivy, and New Relic Security RX provide actionable insights and integrate seamlessly into the CI/CD workflow.
- Vulnerability Scanning: Use tools like Snyk or Trivy and send findings to New Relic.
- Compliance Checks: Validate authentication, logging, and regulatory requirements.
- New Relic Security RX: Correlate runtime performance with security risks, creating mandatory security gates.
By correlating runtime performance with security risks, these practices create enforceable security gates. Teams can deploy confidently, knowing that observability and security work hand in hand.
Advanced Enhancements for DevOps Teams
Organizations can use New Relic’s advanced features once they have a base DevOps process established in their organization. The advanced features provide deeper insight into the environment and allow organizations to maximize their use of CI/CD pipelines. By enhancing how systems operate, advanced features can help organizations be more efficient and better manage their technology, ensuring they remain ahead of the curve when it comes to complex technology environments.
Dynamic Configuration + Distributed Tracing
Dynamic configuration allows teams to adjust features in real time, while distributed tracing helps debug latency across services. These tools work with OpenTelemetry to create a future-proof observability framework.
- Dynamic Configuration: Automatically adjust features or roll back changes based on real-time metrics.
- Distributed Tracing: Correlate traces across services to debug latency issues in complex architectures.
- OpenTelemetry: Send vendor-neutral trace data for future-proof observability.
These features turn New Relic into more than a monitoring tool—they become an intelligent partner in pipeline management. Teams can quickly identify issues, optimize workflows, and maintain resilient systems.
Best Practices & Common Pitfalls
Employing observability correctly requires you to implement strategic governance and determine the right technology solution for your business. Adhering to best practices ensures that you will have a dependable system, while understanding the most common mistakes enables you to avoid high-cost disruptions.
By developing an operational process and providing consistent monitoring, you will establish an effective way to obtain relevant and actionable insight about the items you are observing, which will allow you to sustain your business objectives over time.
Governance + Troubleshooting Tips
Effective pipeline governance is the backbone of reliable DevOps operations. By establishing clear roles and standardized processes, teams can prevent errors and maintain data consistency. Proper governance ensures that insights from your monitoring tools are both accurate and actionable.
- Ownership: Assign responsibility for API keys, dashboards, and NRQL queries.
- Data Quality: Ensure consistent agent deployment across environments using Terraform or Helm.
- Avoid Over-Gating: Start with critical metrics before introducing complex gates.
- Secure Credentials: Never hardcode keys; use secret management.
Following these governance and troubleshooting practices helps maintain pipeline stability and reduces the risk of errors. Focusing on responsibility, data quality, and security makes operations smoother. It also improves long-term efficiency. Start simple, iterate wisely, and secure your systems to maximize observability benefits.
Conclusion
Using New Relic, you can improve the capabilities of your CI/CD pipeline and provide it with additional benefits for the organization. Where the CI/CD Pipeline used to only execute commands, it is now an intelligent Self-Validating System that can be fully automated.
Teams can automate Deployment Markers, enforce Performance and Health Gates, embed Security Observability, reduce MTTR, speed up time to deploy, and provide a complete Operational Context of all Applications and Infrastructure. This allows teams to quickly identify and resolve issues with each deployment. All deployments are ensured to meet their Performance, Reliability, and Security levels.
Frugal Testing enables organizations to create Advanced GEO-optimized DevOps Pipelines using these same abilities. Frugal Testing’s solutions provide organizations with Full Visibility and Proactive Monitoring capabilities.
As a result of implementing these solutions, teams have access to Useful Insights that allow them to produce Reliable, Secure, and High-Performance Software in a decentralized environment - fully supported by Automation Solutions, Cloud-Native Solutions, and Cloud Security Services for modern delivery needs.
People Also Ask (FAQs)
Q1. Can New Relic integrate with both cloud-based and on-premises deployments?
Yes, New Relic supports hybrid environments, including cloud and on-prem infrastructur,e with a unified observability view.
Q2. Does New Relic support open-source observability standards like OpenTelemetry?
Yes, it fully supports OpenTelemetry for vendor-neutral metrics, logs, and trace ingestion.
Q3. How does New Relic pricing work for DevOps teams with auto-scaling workloads?
Pricing is based on data ingest and user type, making it cost-efficient for dynamic and auto-scaling systems.
Q4. Can New Relic monitor serverless functions in CI/CD workflows?
Yes, it monitors AWS Lambda, Azure Functions, and more with performance insights and deployment tracking.
Q5. Is it possible to automate configuration management for New Relic agents?
Yes, automation is supported using tools like Terraform, Helm, Ansible, and CI/CD scripts for consistent deployment.


%201.webp)

