Incorporating performance testing into a CI/CD pipeline is essential for maintaining application quality and stability in today’s fast-paced software delivery cycles. Performance testing, as a process, involves evaluating how an application behaves under different loads, helping teams detect potential bottlenecks and improve overall user experience before deployment.
Popular tools like JMeter are instrumental in CI/CD environments for automating performance tests and providing comprehensive insights into application speed, responsiveness, and stability. Performance testing software, such as JMeter, BlazeMeter, or LoadRunner, allows teams to simulate user loads and assess application performance under realistic conditions.

Key Points We'll Cover in This Blog:
📌 Overview of why performance testing is essential in CI/CD pipelines for delivering faster, more reliable software releases.
📌 A brief explanation of load, stress, endurance, and spike testing, highlighting how each type helps assess different aspects of application performance.
📌 Tips on setting realistic benchmarks, automating tests, and prioritizing critical workflows to ensure efficient CI/CD testing.
📌 Quick guide on tracking response time, error rate, and resource utilization metrics to gain actionable insights into application health.
Introduction to Performance Testing in CI/CD Pipelines
Performance testing is a critical part of CI/CD pipelines, ensuring that applications not only function correctly but also meet performance benchmarks before they reach end-users. In continuous integration (CI) and continuous deployment (CD) pipelines, performance testing tools help to automate and embed quality checks into every release stage, enabling faster, more reliable software delivery.
Integrating web performance and load testing tools in these pipelines ensures that applications can handle real-world traffic conditions, reducing the risk of performance issues in production.
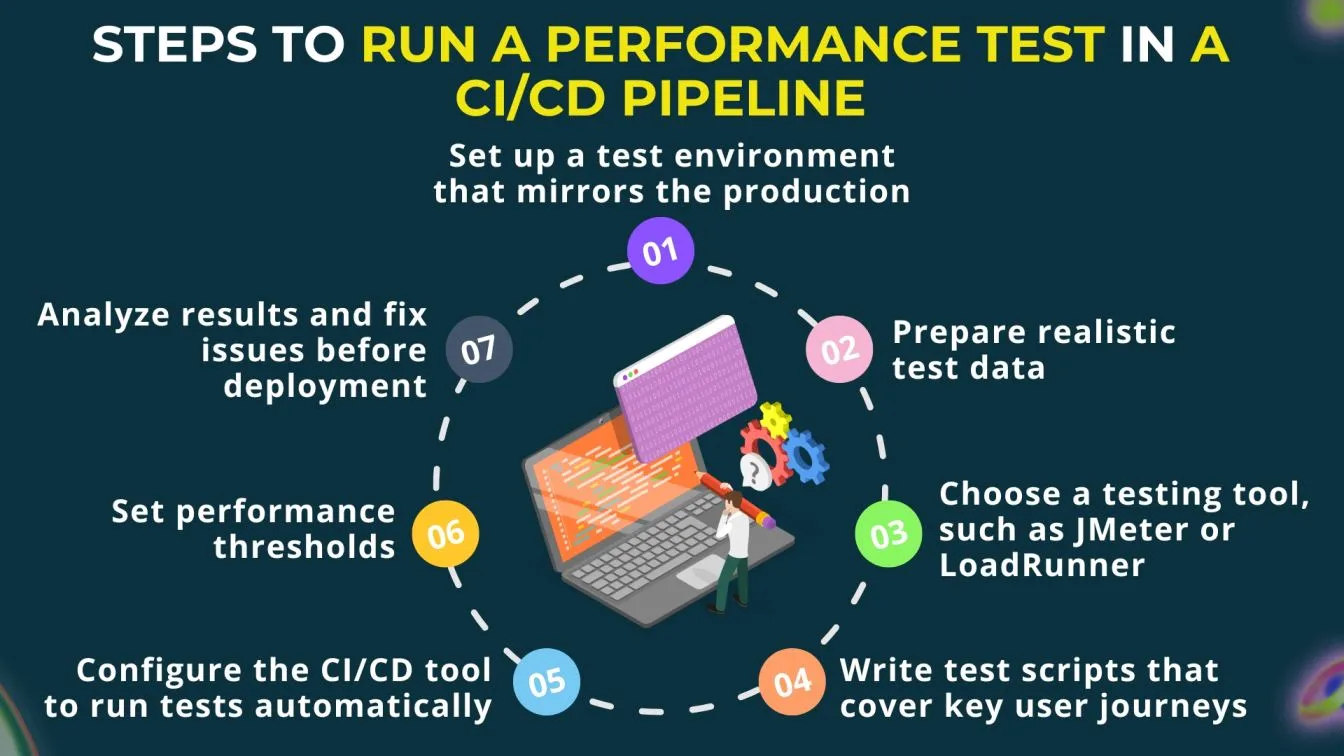
With website performance testing tools like JMeter, Gatling, and LoadRunner, teams can simulate user behavior under different loads, providing valuable insights into an application's stability, speed, and scalability in a CI/CD context. Popular continuous integration tools, such as Jenkins, CircleCI, and GitLab CI, support seamless integration of performance and load testing into CI-CD pipelines. These tools allow development teams to automate testing and deploy new code to staging or production environments with minimal risk.
With continuous integration and continuous deployment (CI/CD) practices, performance tests can run automatically after each code change, identifying bottlenecks early and ensuring that applications meet performance standards before deployment. By incorporating performance testing in continuous integration vs. continuous deployment workflows, teams enhance application quality, improve user experience, and maintain release agility in the fast-paced DevOps environment.
Types of Performance Tests to Include in CI/CD
Performance testing is a critical aspect of the software development lifecycle, especially in Continuous Integration/Continuous Deployment (CI/CD) environments. It ensures that applications can handle expected loads and perform efficiently under varying conditions. Here are the key types of performance tests to incorporate into your CI/CD pipeline.
Load Testing
Load testing is an essential performance testing method that assesses how a system behaves under expected user loads. By simulating a high volume of concurrent users, load testing helps identify potential bottlenecks and performance issues before the software is deployed.
In a CI/CD pipeline, integrating load testing allows teams to continuously evaluate the application's scalability and responsiveness, ensuring it can handle real-world traffic when launched.
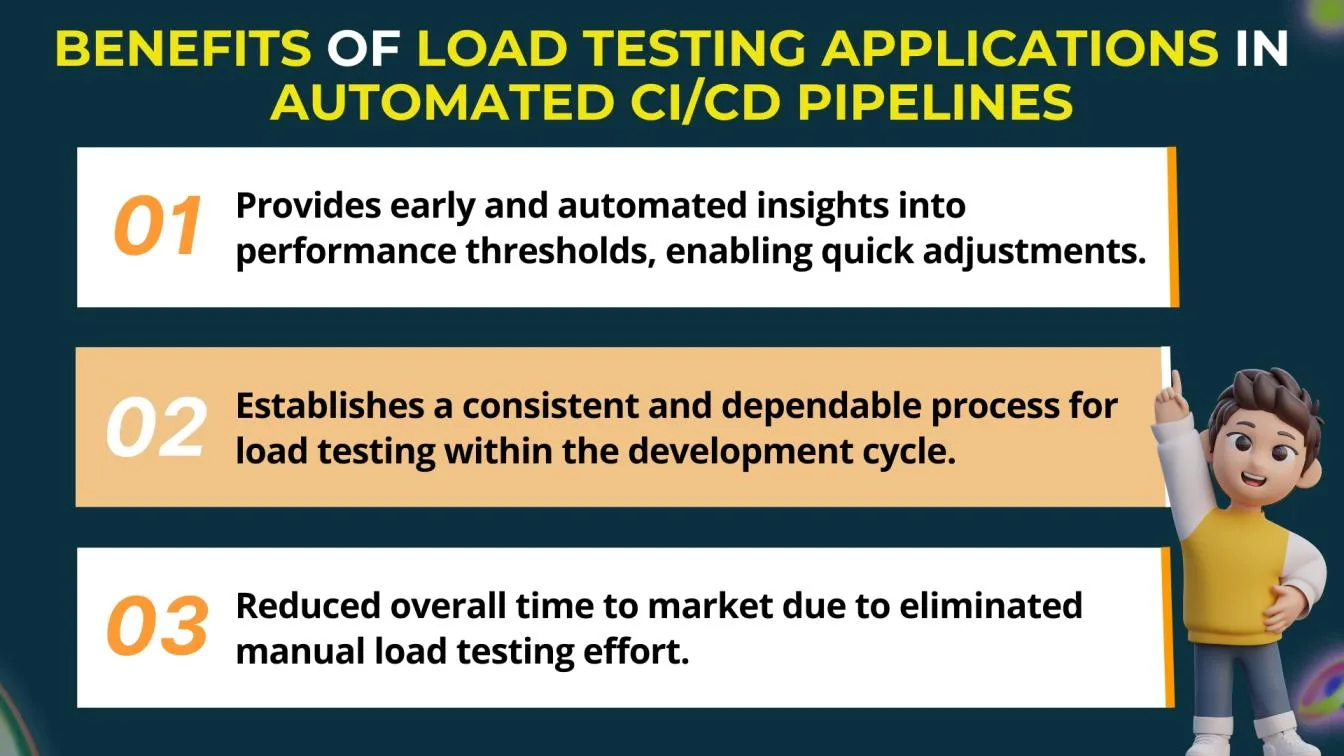
Incorporating load testing into CI/CD also facilitates faster feedback loops for developers. Automated load tests can be triggered alongside other tests whenever new code is integrated, providing immediate insights into how changes impact performance. This enables teams to address performance concerns early in the development process, rather than waiting until later stages or after deployment.
Stress Testing
Stress testing in CI/CD is a critical performance testing approach that evaluates how an application behaves under extreme conditions, pushing it beyond its normal operational limits. By simulating scenarios that generate excessive load or data processing demands, stress testing helps identify the application's breaking points and assesses its stability under stress.

Integrating stress testing into the Continuous Integration/Continuous Deployment pipeline allows development teams to continuously monitor the resilience of their applications as new code changes are introduced.
This proactive approach ensures that performance issues are identified and addressed before they impact users. The primary goal of stress testing is to ensure that applications can withstand unexpected surges in traffic or heavy workloads without encountering critical failures.
Endurance Testing
Endurance testing, also known as soak testing, is a performance testing technique that evaluates how an application performs over an extended period under a sustained load. In CI/CD pipelines, endurance testing is essential for ensuring that applications can handle prolonged usage without degrading performance or stability.
By simulating typical user activity over an extended duration, teams can identify issues such as memory leaks, resource consumption spikes, and performance degradation that may not be evident during shorter testing sessions.
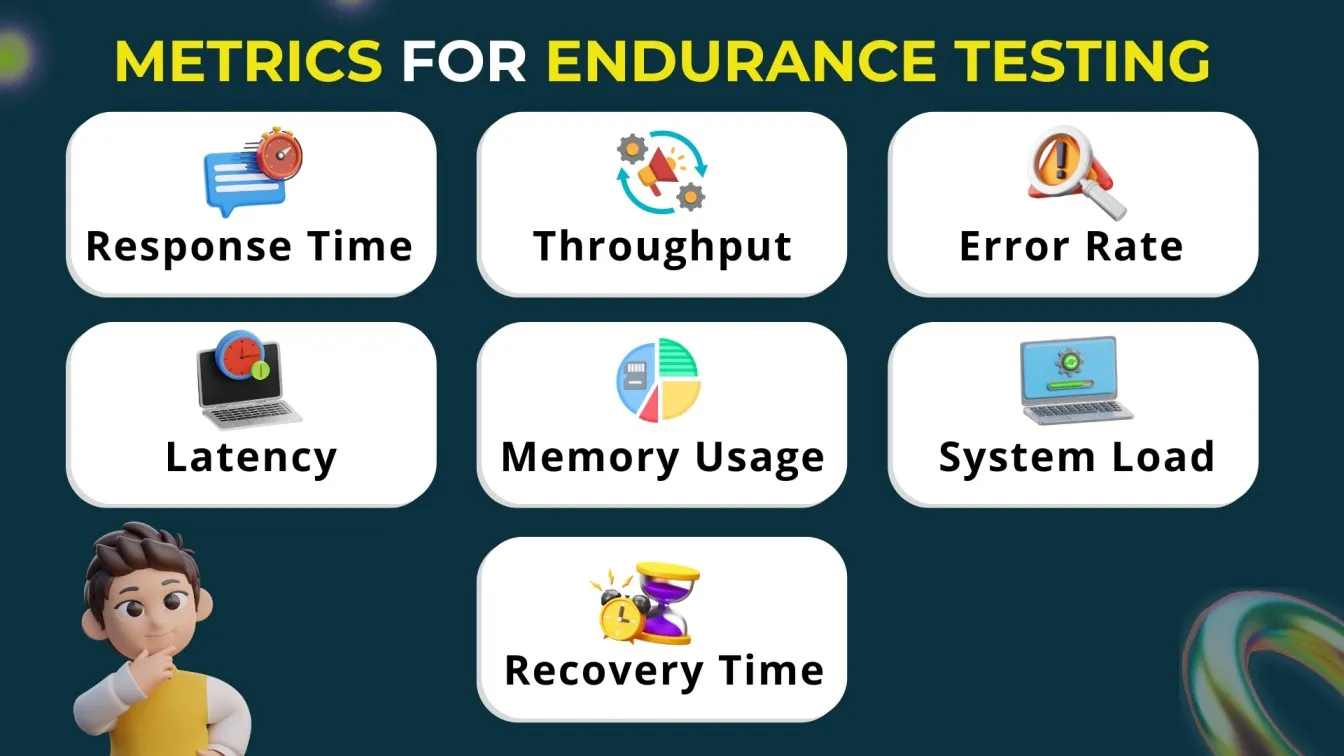
Integrating endurance testing into the CI/CD process allows for continuous monitoring of application behavior as new code is deployed. This proactive approach helps teams ensure that the application remains reliable and efficient under real-world conditions, even after prolonged usage.
By identifying potential issues early, organizations can enhance the application's resilience and improve overall user experience, ultimately leading to greater customer satisfaction and retention.
Spike Testing
Spike testing is a performance testing technique that evaluates how an application responds to sudden and extreme increases in load for a short duration. In CI/CD pipelines, spike testing helps ensure that the application can handle unexpected traffic surges, such as during promotional events or product launches, without compromising performance or stability.
This type of testing is critical for identifying potential weaknesses in the application’s architecture and its ability to scale under pressure.
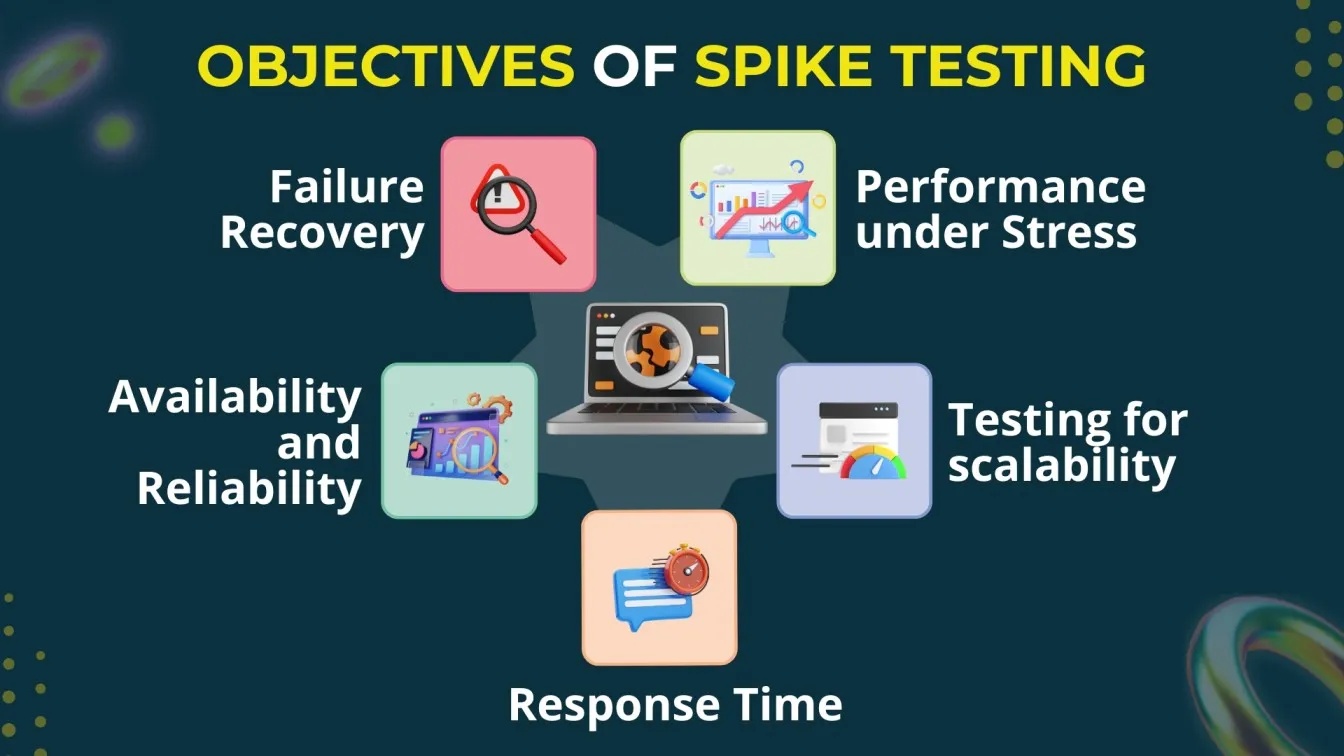
Integrating spike testing into the CI/CD process allows teams to simulate rapid load increases and assess the system’s behavior in real time. This proactive approach helps identify performance bottlenecks, resource constraints, and failure points, enabling developers to make necessary adjustments before deployment.
By ensuring that the application can withstand sudden spikes in usage, organizations can enhance user experience, prevent downtime, and maintain customer satisfaction during high-demand periods.
Tools for Automating Performance Testing in CI/CD
Automating performance testing in a CI/CD pipeline is crucial for ensuring applications meet performance standards. Tools like Apache JMeter and Gatling are commonly used for this purpose. JMeter can simulate heavy loads on servers, making it ideal for testing various performance scenarios.
Additionally, its extensive plugin ecosystem allows for customization and integration with other testing tools. Gatling, tailored for web applications, offers a powerful scripting interface that simplifies the creation of complex performance tests and generates insightful reports, making it easier for teams to analyze results and make informed decisions.

Integrating performance testing tools into CI/CD helps identify bottlenecks early, reducing the risk of performance issues in production. Tools like K6 or Locust can automate performance tests after each build, ensuring consistent monitoring of performance metrics.
Furthermore, these tools can provide real-time feedback to developers, enabling immediate adjustments and optimizations. This proactive approach enhances application reliability and optimizes user experience, allowing organizations to release updates faster while maintaining performance benchmarks.
Continuous integration load testing is essential for ensuring application stability in a CI/CD pipeline testing environment. Implementing automated testing in CI/CD pipeline helps teams identify performance bottlenecks. DevOps load testing and performance testing in DevOps streamline testing workflows, while AWS distributed load testing enables scalability.
How to Set Up Performance Testing in CI/CD Pipelines
1. Choose the Right Tools
- Select performance testing tools that fit your application’s architecture and testing needs, such as Apache JMeter, Gatling, K6, or Locust.
- Ensure the chosen tools support automation and can easily integrate with CI/CD platforms.
2. Define Performance Criteria
- Identify key performance metrics to be tested, such as response time, throughput, and resource utilization.
- Establish performance benchmarks and define acceptable limits for each metric to guide testing.
3. Create Performance Test Scripts
- Develop performance test scripts that simulate real user scenarios and loads based on expected usage patterns.
- Ensure scripts are maintainable and reusable across different testing environments.
4. Integrate with CI/CD Tools
- Integrate the performance testing tools with your CI/CD pipeline (e.g., Jenkins, GitLab CI, CircleCI).
- Configure the pipeline to trigger performance tests automatically during relevant stages, such as after a build or prior to deployment.
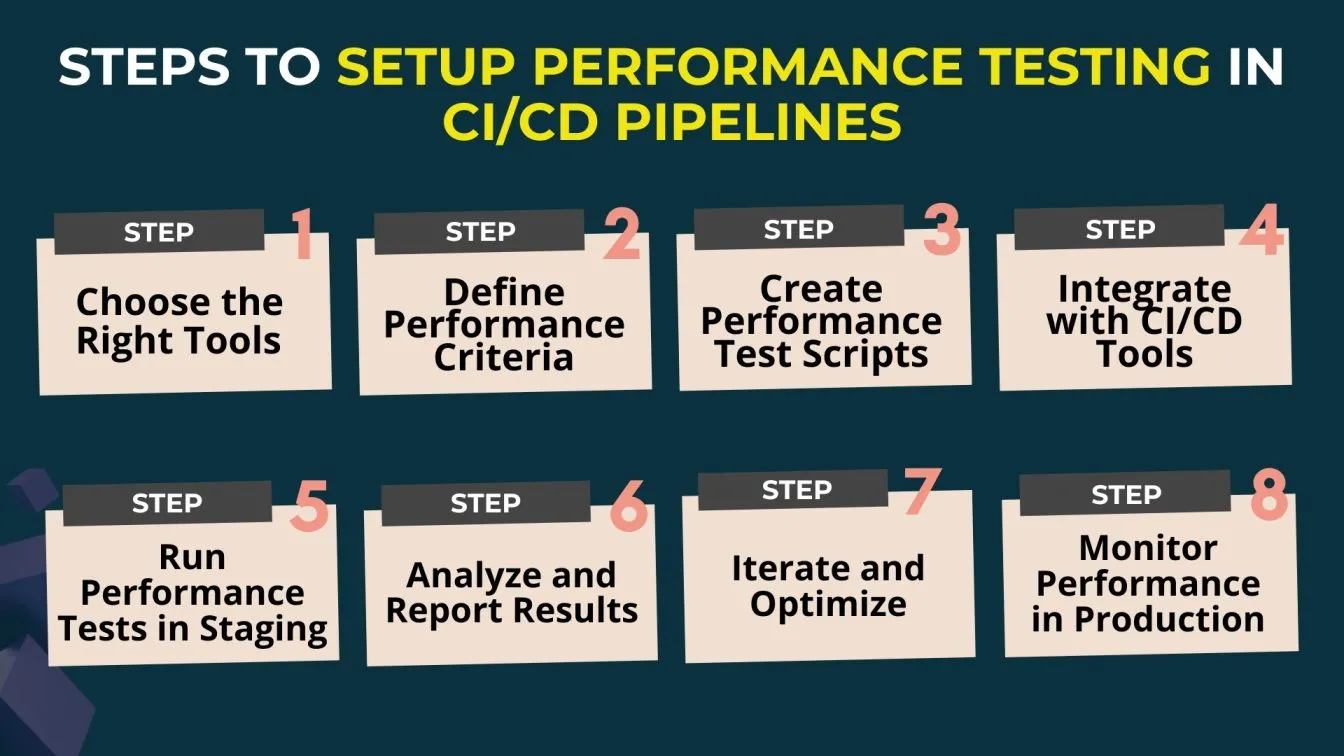
5. Run Performance Tests in Staging
- Set up a staging environment that closely mirrors the production environment to execute performance tests.
- Conduct regular performance tests to identify bottlenecks and monitor application behavior under load.
6. Analyze and Report Results
- After running tests, analyze the results against the defined benchmarks.
- Generate reports that summarize performance metrics and highlight any issues or areas for improvement.
7. Iterate and Optimize
- Use the insights gained from performance tests to optimize application code, infrastructure, and configuration.
- Continuously update and refine test scripts to adapt to changes in the application or user behavior.
8. Monitor Performance in Production
- Implement monitoring tools to track performance metrics in the production environment.
- Use this data to inform future performance testing and ensure the health of the ongoing application.
Best Practices for Performance Testing in CI/CD Workflows
1. Automate Performance Tests
- Integrate performance tests into your CI/CD pipeline to run automatically with every build or deployment. This practice helps catch performance issues early in the development cycle, allowing for quicker fixes before they impact production.
2. Establish Clear Performance Goals
- Define specific performance metrics such as response times, throughput, and resource utilization, along with acceptable thresholds for each. Establishing these goals provides direction for your testing efforts and creates benchmarks for assessing application performance.
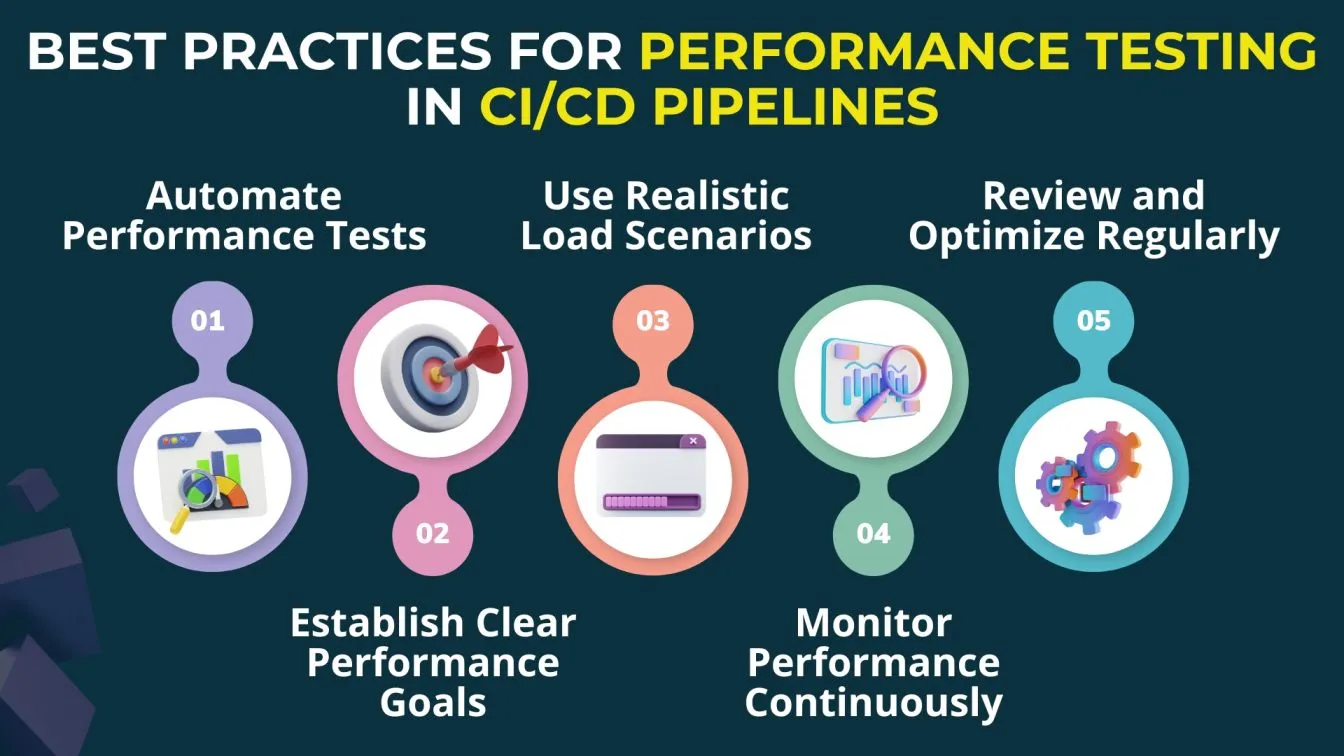
3. Use Realistic Load Scenarios
- Create performance test scripts that reflect realistic user behavior and load patterns based on actual usage data. Simulating real-world scenarios helps identify potential bottlenecks that could occur under expected traffic conditions.
4. Monitor Performance Continuously
- Implement monitoring tools in your production environment to track application performance continuously. Real-time monitoring provides insights into how the
5. Review and Optimize Regularly
- Regularly review performance test results and use them to optimize your application and infrastructure. Continuous assessment and improvement help ensure that the application meets evolving performance requirements.
By implementing these best practices, teams can effectively incorporate performance testing into their CI/CD workflows, leading to improved application performance and stability.
Using pipeline optimization techniques, teams enhance pipeline speed for faster deployments. Effective CI monitoring and a continuous delivery checklist ensure smooth releases. By integrating distributed load testing on AWS, organizations improve reliability in CD testing and testing in continuous integration, optimizing overall system performance.
Common Challenges in Performance Testing for CI/CD Pipelines
In the software development process, ensuring high-quality software is paramount, and this requires a combination of careful planning and effective deployment processes. Automated testing, particularly through the use of unit tests, plays a crucial role in achieving this goal by minimizing human errors and reducing the need for manual intervention.
As part of a continuous delivery model, continuous testing enables teams to maintain code quality through regular code reviews and by evaluating the source code against performance benchmarks.
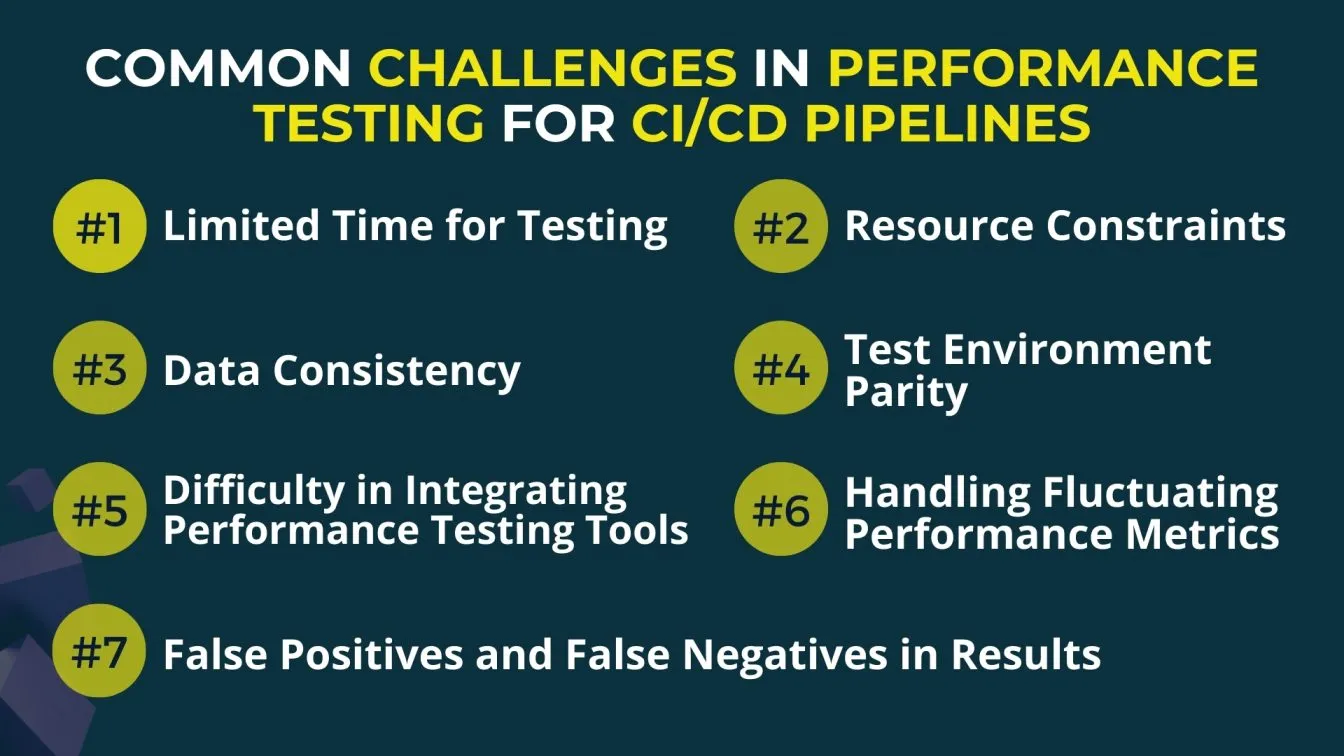
However, challenges arise in maintaining software quality, particularly in dealing with the complexities of the user interface and the need to test repetitive tasks efficiently. The iterative process of development necessitates continuous improvement to address these challenges and enhance performance testing strategies.
By integrating performance testing into CI/CD pipelines, organizations can ensure their applications are robust, scalable, and capable of delivering an optimal user experience.
Integrating Performance Testing with Popular CI/CD Platforms
Integrating performance testing with popular CI/CD platforms enables teams to automatically assess application performance with every code change, ensuring a smoother and more reliable user experience. Here’s how to integrate performance testing with some of the most popular CI/CD platforms:

1. Jenkins
- Integration: Jenkins supports performance testing through plugins and command-line executions.
- Tools: Use the Performance Plugin for JMeter, Gatling, and other testing tools. This plugin can graphically display performance test results over time.
- Configuration:
- Add performance tests as separate stages in the Jenkins pipeline.
- Configure thresholds for pass/fail criteria to automatically halt the pipeline if performance degrades.
2. GitLab CI/CD
- Integration: GitLab CI/CD allows you to add performance tests as stages in your .gitlab-ci.yml file.
- Tools: Use tools like K6, JMeter, or Gatling in Docker containers to run performance tests.
- Configuration:
- Define a performance test stage in the GitLab pipeline file.
- Use Docker images for the testing tools, enabling easy setup and execution in GitLab runners.
- Integration: GitHub Actions supports performance testing workflows through reusable actions.
- Tools: Run tools like K6, Artillery, Gatling, or JMeter within GitHub Actions by setting up custom actions or using pre-built ones.
- Configuration:
- Create a separate workflow YAML file or add performance testing as a job within the main pipeline.
- Set up thresholds and conditions to prevent deployment if tests do not meet performance requirements.
4. Azure DevOps
- Integration: Azure DevOps supports performance testing via custom pipelines and tasks.
- Tools: Use Apache JMeter, LoadRunner, or Azure’s own Application Insights for load testing.
- Configuration:
- Set up a separate performance testing pipeline or add a dedicated stage to existing pipelines.
- Use Azure’s testing extensions or deploy Docker containers with performance testing tools.
5. CircleCI
- Integration: CircleCI enables performance testing via Docker containers and configuration files.
- Tools: Use tools like Gatling, K6, or Artillery in Docker containers for automated performance testing.
- Configuration:
- Add a performance testing job in the .circleci/config.yml file.
- Run tests as a separate job to keep it isolated from functional tests.

Metrics to Track in CI/CD Performance Testing
Tracking the right metrics in CI/CD performance testing is essential to ensure that every release meets performance standards without compromising speed and stability. Key metrics include response time, which measures how quickly the system processes requests, and throughput, which indicates the number of requests the system can handle per unit of time.
Additionally, the error rate tracks the percentage of requests that result in errors, indicating potential stability issues that need immediate attention. Keeping error rates low is essential for reliable performance, especially as systems scale or traffic fluctuates.

Other important metrics are CPU and memory utilization, which provide insights into resource efficiency and help identify bottlenecks. Tracking latency reveals the time it takes for requests to reach the server and respond, crucial for understanding network and processing delays. Apdex (Application Performance Index) score is also valuable for gauging overall user satisfaction by measuring how well response times meet defined performance thresholds.
Monitoring and Analyzing Performance Testing Results
Monitoring performance testing results involves tracking key metrics in real-time to identify issues as they arise. Continuous monitoring provides visibility into metrics like response time, error rate, throughput, and resource utilization (CPU, memory, and network I/O), which helps detect bottlenecks or performance degradations early.
Using tools like Grafana, Prometheus, or New Relic, teams can set up alerts based on threshold breaches, ensuring that any unexpected performance issues are addressed before they impact end-users.
Analyzing performance testing results focuses on identifying patterns and areas for improvement by examining trends and comparing results over time. This involves looking at detailed reports to understand average performance, spikes, and the distribution of metrics across different scenarios and load levels.
Analyzing results helps uncover root causes of performance drops, such as specific code changes or inefficient resource usage, and assess whether the application meets predefined benchmarks.
Future Trends in Performance Testing for CI/CD
Future trends in performance testing for CI/CD are moving toward increased automation and integration of AI-driven tools. As CI/CD pipelines demand faster testing cycles, AI and machine learning are being integrated to automatically detect anomalies, predict potential bottlenecks, and suggest optimizations.
This shift toward "intelligent testing" enables performance tests to be more adaptive, focusing on areas most likely to encounter issues, thus reducing overall testing time while improving reliability.

Another major trend is the shift toward continuous performance monitoring throughout the entire development lifecycle, rather than just at release points. Performance testing is evolving to become an ongoing activity, with real-time insights feeding directly back into development.
This continuous monitoring allows teams to maintain a consistently high standard of performance, even as applications evolve and scale.
RECAP
Integrating performance testing into CI/CD pipelines is crucial for ensuring software quality and reliability. This blog discusses the essentials of performance testing, focusing on how load, stress, endurance, and spike tests help identify bottlenecks and improve application stability and speed.
With tools like JMeter, Gatling, and LoadRunner, teams can automate performance tests to continuously assess application health at every stage of development. By embedding these tests in CI/CD, teams catch issues early, maintain release agility, and ensure applications are ready to meet user demands.
We also cover best practices such as setting clear performance goals, using realistic load scenarios, and monitoring key metrics like response time, error rate, and resource utilization. Addressing common challenges like limited testing time and resource constraints, this guide offers practical solutions for optimizing performance testing in CI/CD.
Finally, we look at future trends, including AI-driven testing and continuous monitoring, which enable more adaptive and efficient performance testing. With these strategies, teams can improve CI/CD workflows and deliver high-quality, reliable software releases.
Additionally, Frugal Testing offers comprehensive cloud-based test automation services, ensuring seamless integration within CI/CD pipelines for optimized testing efficiency.

People Also Ask
👉How to implement QA testing in CI/CD pipelines?
Implement QA testing by integrating automated tests (unit, integration, functional) into each CI/CD stage, ensuring code quality checks after each commit or before deployment. Use tools like Jenkins, GitLab CI, or GitHub Actions to automate these tests within the pipeline.
👉How is CI/CD performance measured?
CI/CD performance is measured using metrics such as build time, deployment frequency, mean time to recovery (MTTR), and success/failure rate. These metrics provide insights into pipeline efficiency, speed, and reliability.
👉How do you run a test in a CI/CD pipeline?
To run tests, configure automated test scripts in the CI/CD pipeline configuration file (e.g., .yml for GitLab CI or .yaml for GitHub Actions) to trigger after each build, ensuring quality checks align with the pipeline stages.
👉Which unit testing tool is used in CI/CD pipelines?
Popular unit testing tools in CI/CD include JUnit for Java, PyTest for Python, and JUnit or Mocha for JavaScript, enabling automated and continuous testing with each code change.
👉What is the difference between CI testing and CD testing?
CI (Continuous Integration) testing focuses on verifying new code changes by running automated tests after each commit, while CD (Continuous Deployment) testing ensures the application performs reliably in production-like environments before release.


%201.webp)

