
Microservices rarely fail in obvious ways. They don’t always crash. They don’t always throw errors. And they certainly don’t always turn your dashboards red.
Instead, they fail quietly.
A checkout service returns incomplete data. A recommendation engine responds but with outdated results. An API passes its health check but silently drops fields due to a schema mismatch. Everything looks “green.” But users feel something is wrong. These are silent failures and they’re one of the most dangerous reliability risks in modern distributed systems.
In this guide, we’ll break down:
- What silent failures actually are (and why traditional monitoring misses them)
- Why “up vs. down” metrics are no longer enough in microservices architectures
- How anomaly detection helps uncover unknown failure patterns
- How retry loops and hidden latency are revealed by distributed tracing
- How to create a scalable pipeline for telemetry that correlates traces, metrics, and logs
- Best practices that SRE and DevOps teams can put into practice right away
What Is a Silent Failure in Microservices?
A silent failure in microservices occurs when a service appears healthy (passes health checks) but returns incorrect, incomplete, delayed, or degraded responses. Unlike system crashes, silent failures bypass traditional monitoring because infrastructure metrics remain “green” while user experience deteriorates.
The Silent Failure Crisis in Microservices: Why Monitoring Isn’t Enough
Traditional monitoring is built on a simple binary: a service is either "up" or "down." In a monolithic world, this was sufficient. In modern architectures like serverless functions and Internet of Things (IoT) networks, the biggest risks aren’t outages; they're silent “grey” failures.
A silent failure occurs when a component is technically running but is functionally broken due to security gaps, a hidden compliance breach, or malformed data such as a failed JSON Schema validation. This creates differential observability your IT Ops Managers see green dashboards, while customers experience degraded performance.
Moving Beyond Simple Monitoring to Cloud Observability
Monitoring is about the "known knowns." You pre-define thresholds for CPU, memory, and error rates. But microservices fail in "unknown" ways due to emergent dependencies. Infrastructure observability allows you to understand the system's internal state by analyzing the telemetry it emits. It reveals why a critical role service is timing out only during specific API calls, enabling you to make informed decisions faster.
The Business Impact of "Grey Failures" in Distributed Systems
Silent failures create a gap between metrics and reality. Because they often bypass deadman alerts, they result in
- Inflated MTTR : "Green" dashboards cause cross-team finger-pointing and "war room" fatigue during active outages.
- Revenue Leaks : P99 latency spikes the "slow is the new down" effect directly driving checkout abandonment.
- Trust Erosion : Chronic "flaky" behavior damages brand reputation even when the official status page remains green.
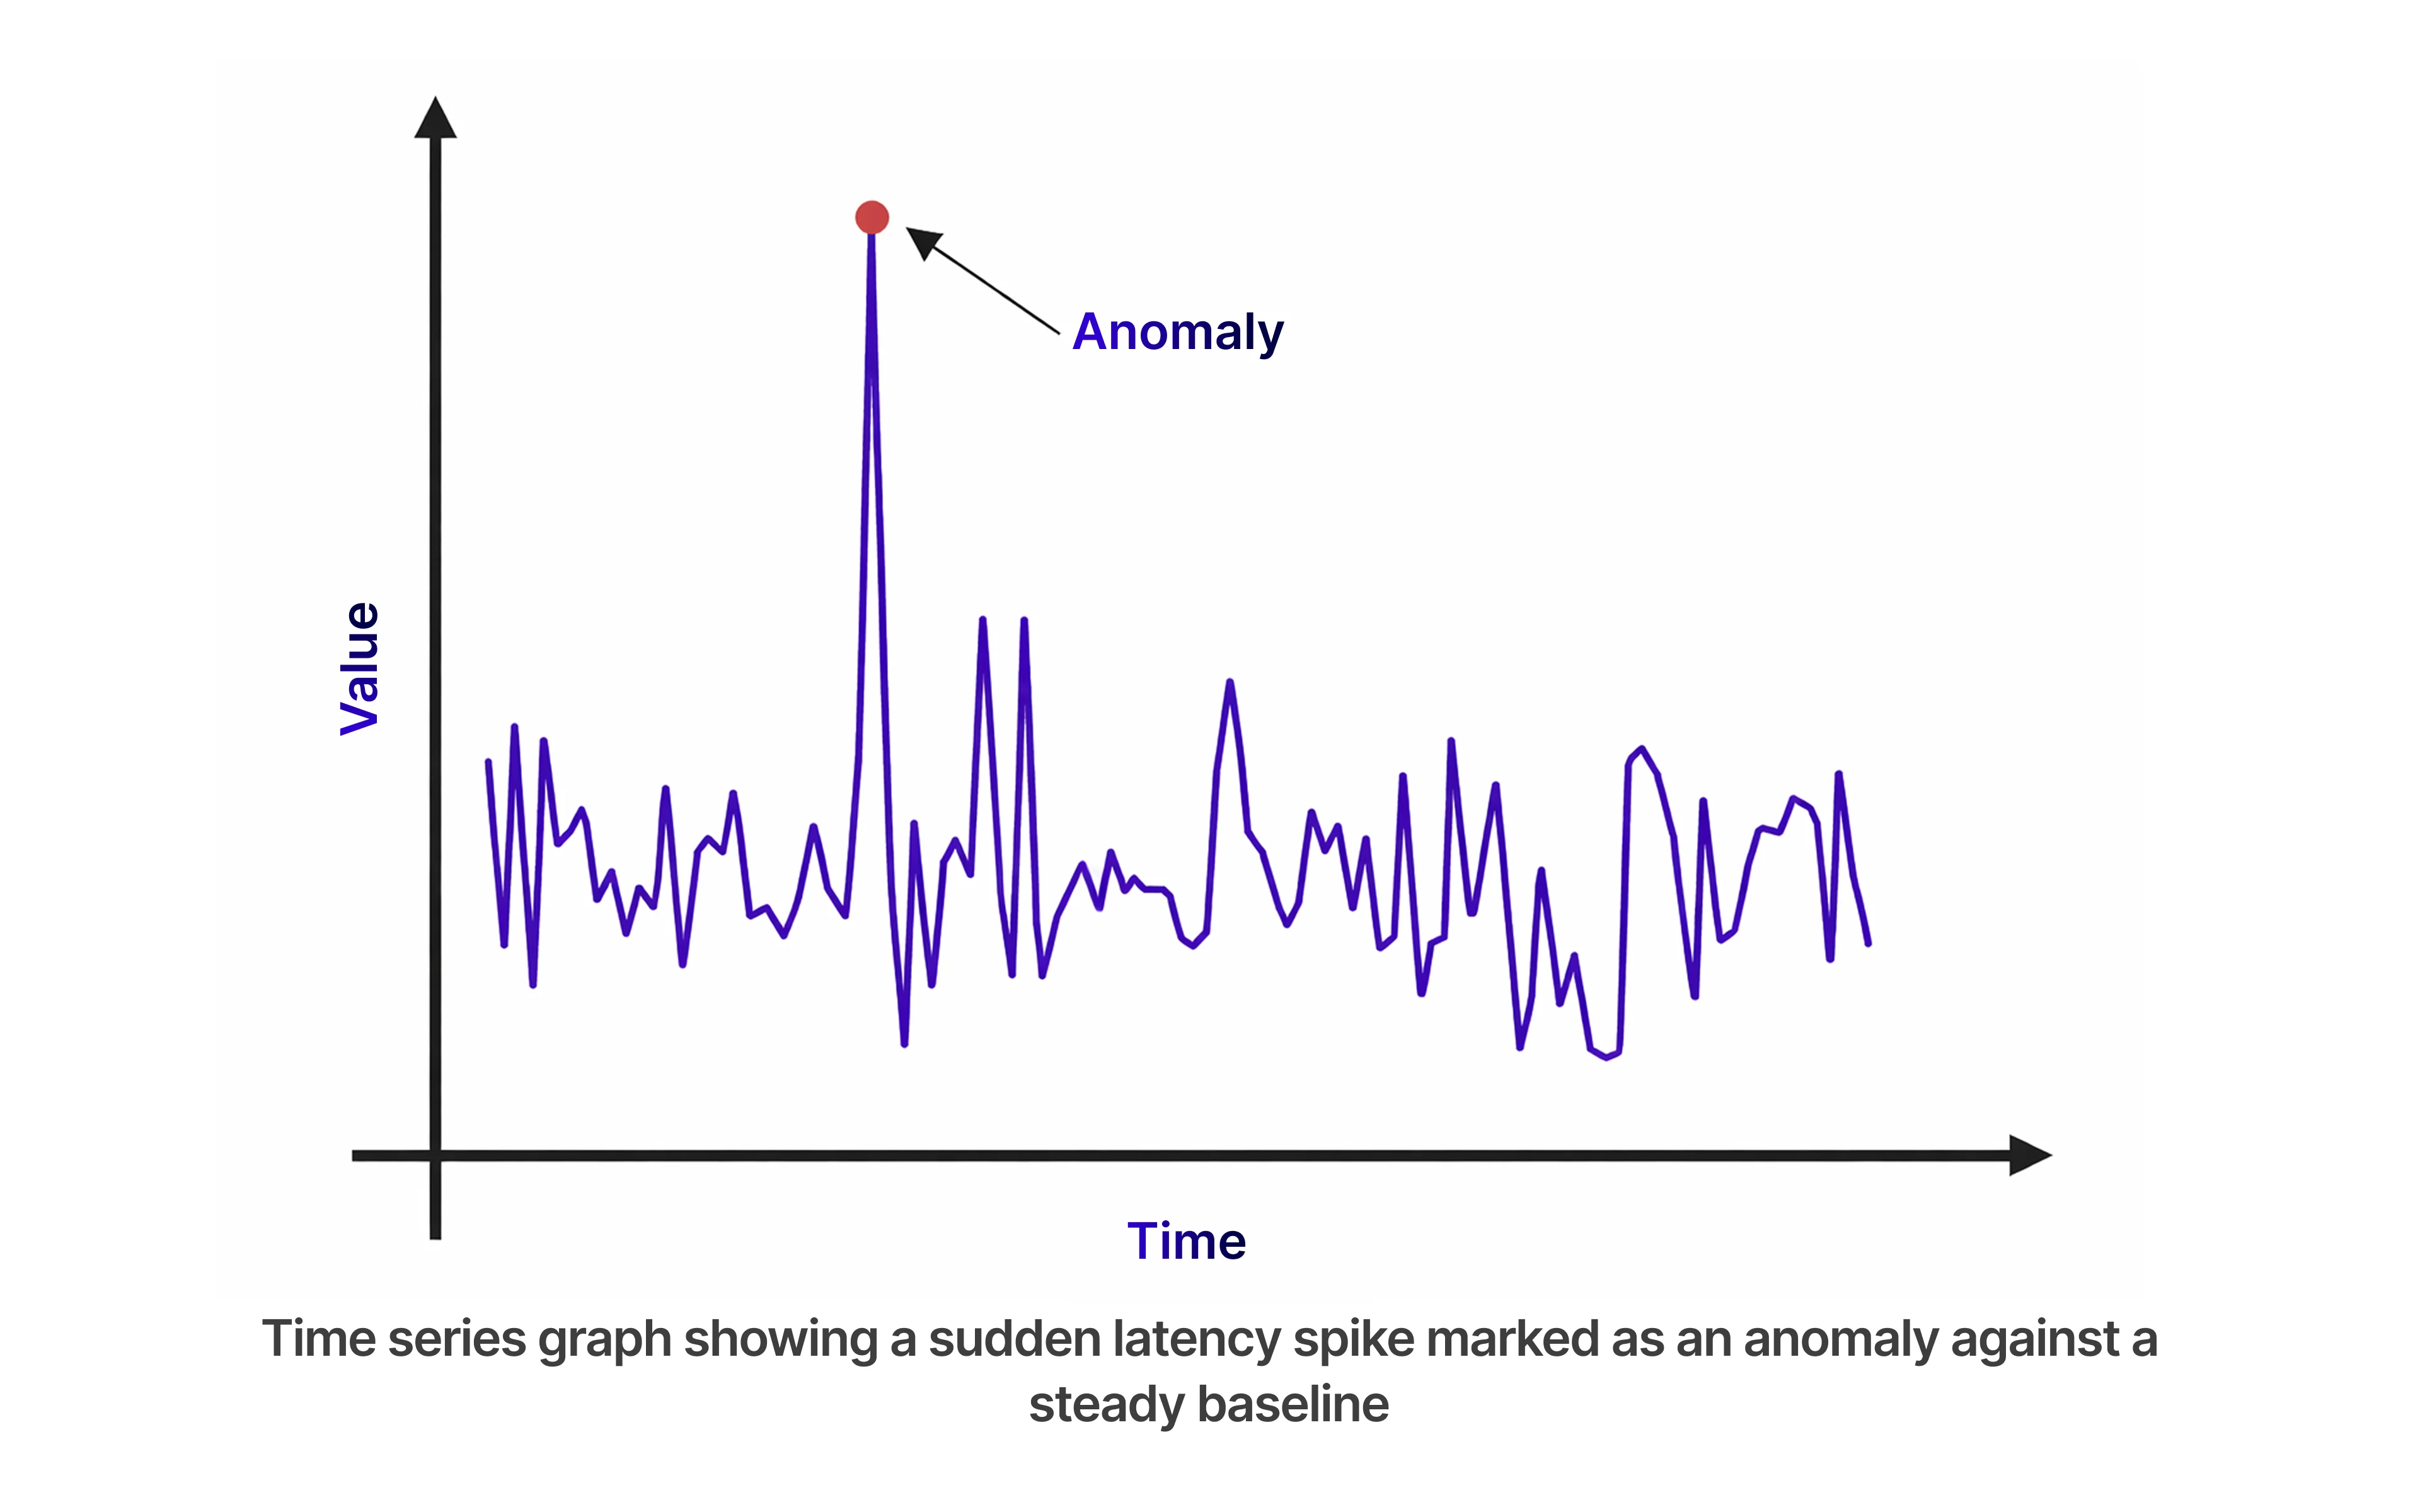
Using Anomaly Detection to Detect Silent Failures
If monitoring is about watching for a house fire, anomaly detection is about noticing the smell of smoke. Static thresholds don’t scale.Real-world performance validation, like this JMeter-based case study, shows how traffic simulation reveals hidden bottlenecks before production impact. A time series database like InfluxDB 3 helps build dynamic baselines, trigger schedule alerts, and raise intelligent error flags automatically.
Identifying "Unknown Unknowns" with Anomaly Detection
The primary challenge is the failure mode you haven't predicted. This is increasingly critical with the rise of large language models and AI agents.
- Metric Drift: A slow, steady increase in memory usage that hasn't hit the "critical" 80% mark yet but is trending toward a leak.
- Agent Observability: In AI apps, silent failures include model drift, poor factual grounding, or prompts and responses getting stuck in reasoning loops. You need to trace tool calls to vector databases to ensure model configuration is performing as expected.
- Correlation Shifts: When Service A’s latency usually stays within 5ms of Service B’s, but suddenly starts lagging by 50ms without crashing.
Modern tools now include semantic analysis layers to catch these issues, ensuring a high safety score even as models evolve.
Statistical vs. ML Anomaly Detection: Choosing the Right Model
Not all detection methods are created equal. Depending on your scale and data noise, you will likely need a hybrid approach
- Statistical Anomaly Detection : Uses mathematical models like Z-Score or IQR to detect deviations. Best for stable, low-volatility metrics such as disk usage or background processes due to low overhead and high explainability.
- ML Anomaly Detection : For high-cardinality or seasonal data, models like Isolation Forest or LSTM learn traffic patterns. They distinguish expected spikes from real anomalies, reducing alert fatigue in user-facing APIs.
SRE teams can transition from reactive debugging to real-time investigation by integrating these models alongside a strong performance testing strategy for microservices.
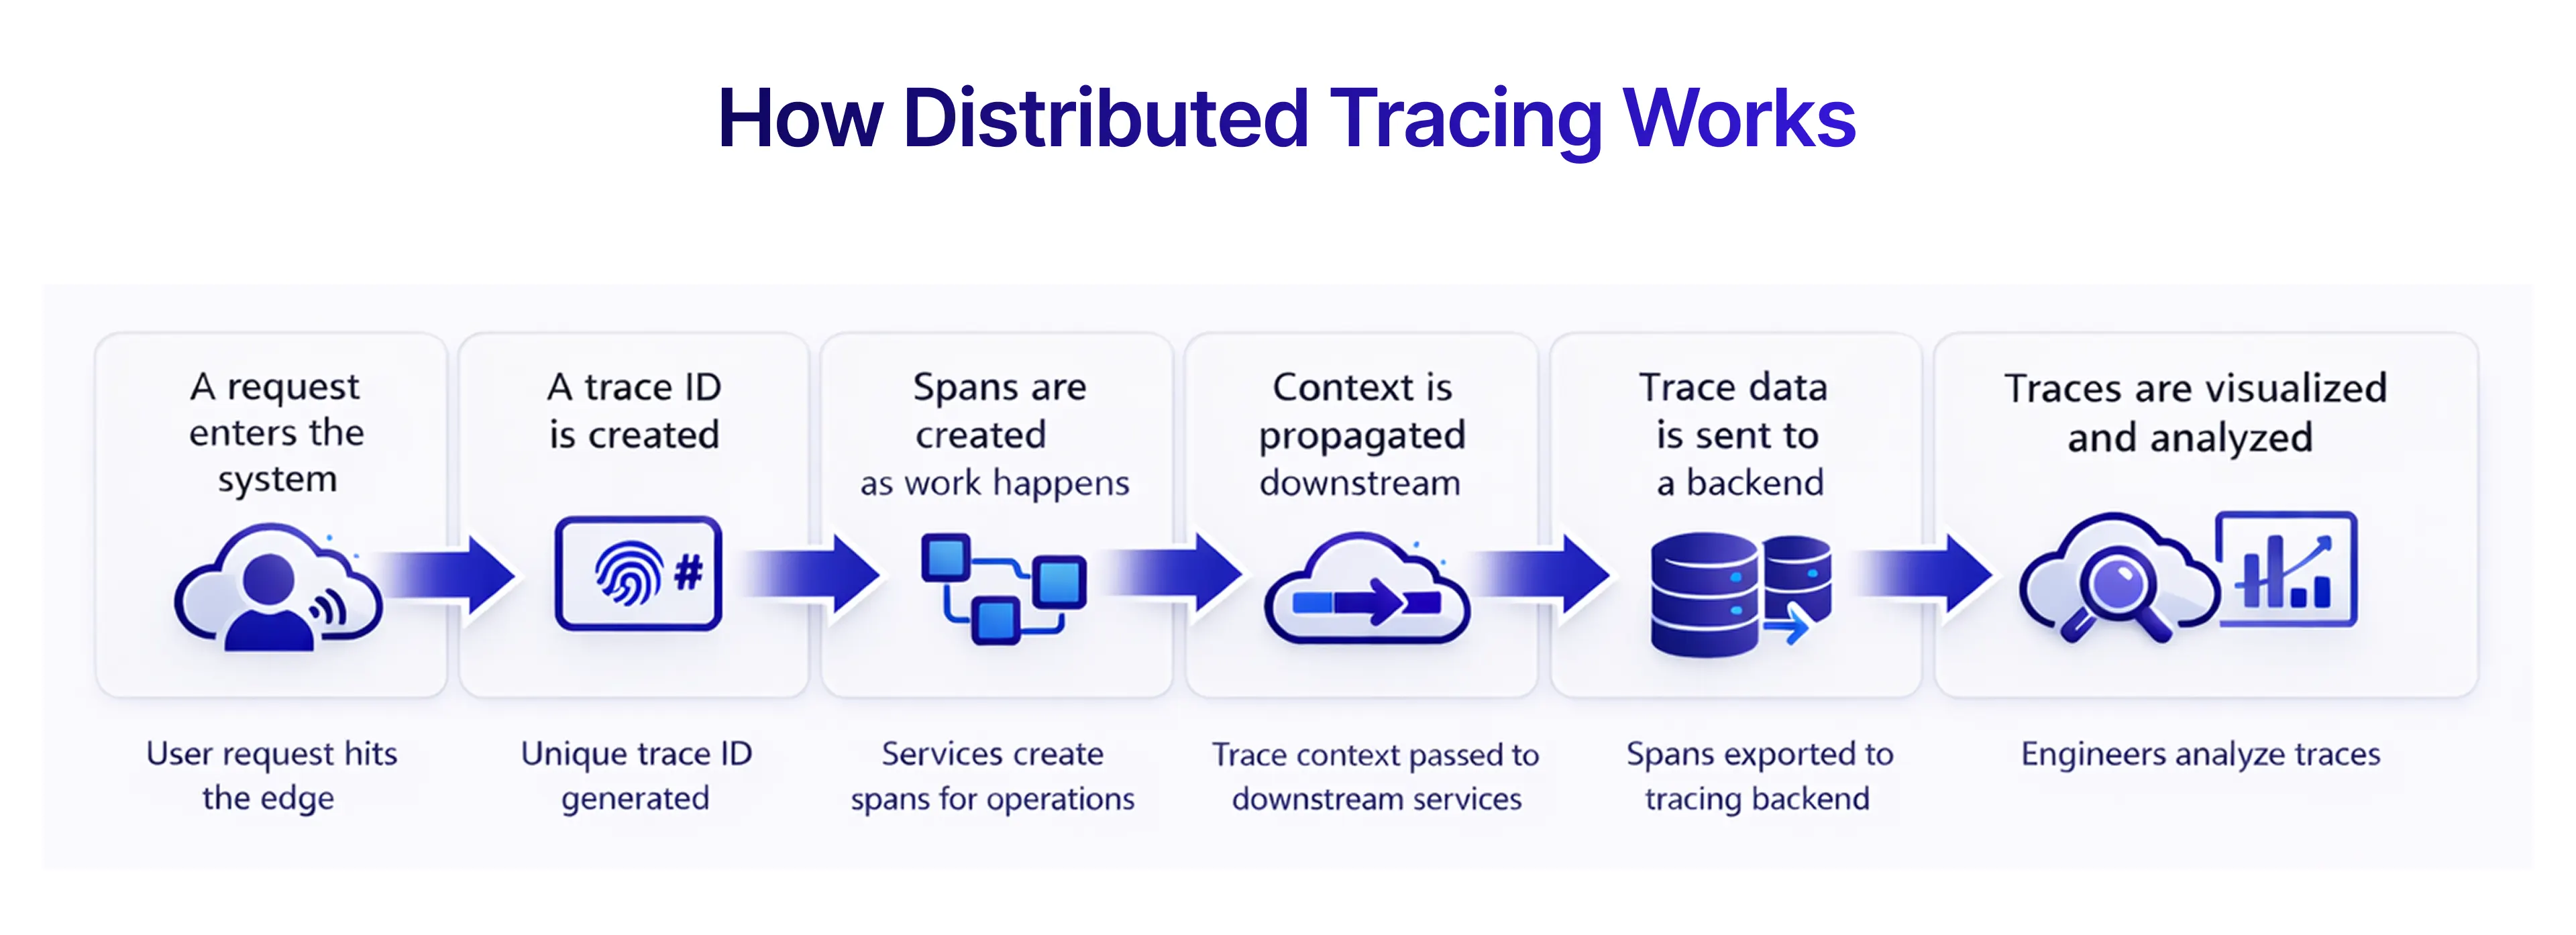
Distributed Tracing in Microservices: Investigating Hidden Failures
Anomaly detection flags that something is wrong tracing shows where. In a microservices architecture, a single user click involves complex dependencies. For example, a failure might occur not because a service crashed, but because a JSON Schema validation silently dropped data between services. Distributed tracing provides the connective tissue to follow request lifecycles across API calls, microservices, and your continuous delivery pipeline. It reveals where a critical role service slows down, even when no errors are thrown.
For example, we observed a production incident where checkout latency increased by 40%. No errors were logged. Distributed tracing later revealed a retry loop between two services that doubled database calls without triggering any failure alerts.
Best Practices for Implementing Distributed Tracing in Microservices
To gain true visibility, high-performing teams adhere to these standards
- Standardize Context Propagation : Use W3C Trace Context to ensure metadata remains intact across polyglot stacks and external tools.
- Adopt OpenTelemetry (OTel) : Instrument applications once with OTel to avoid vendor lock-in for your distributed tracing system.
- Tail-Based Sampling : Capture 100% of error/high-latency traces while discarding "healthy" spans to manage storage costs.
- Auto-Instrumentation : Deploy language agents to capture SQL and HTTP calls automatically without manual code changes.
Using Distributed Application Tracing to Find "Hidden" Latency
The most frustrating silent failure is "micro-latency" delays that aren't long enough to trigger a timeout but are significant enough to degrade the user experience. Without distributed tracing and without validating changes properly in your CI/CD pipeline these bottlenecks usually go unnoticed until production.
Consider a scenario where your P99 latency suddenly climbs. A trace "waterfall" view often reveals structural inefficiencies that metrics alone cannot show
- Sequential Execution Bottlenecks : Identifying where services are calling each other in a "waterfall" pattern when they could be executing in parallel.
- Circular Dependencies : Spotting instances where Service A calls Service B, which unnecessarily calls Service A again, bloating the response time.
- Database Connection Leaks : Tracing can reveal if a service is holding onto a connection for too long, causing downstream "queuing" that looks like a slow network but is actually a resource management issue.
The Foundation: Building a Scalable Telemetry Pipeline
A scalable telemetry pipeline treats observability as a control plane, centralizing logs, metrics, and traces into a single platform for meaningful telemetry Insight.This approach aligns closely with structured quality engineering practices outlined in the Frugal Testing methodology.
Centralized Logging Strategies for Microservices
When a request fails silently, the answer is usually buried in a log. But those logs are essentially invisible if they are dispersed throughout a hundred transient containers. The process of moving all log data to a single, searchable repository is known as centralized logging, providing essential Telemetry Insight.
You should use these tactics if you want to accomplish this successfully and on a large scale:
- Structured Logging (JSON) : Ensure logs are machine-readable for filtering by user_id or trace_id.
- Dynamic Log Levels : Switch from "Error" to "Debug" during incidents without redeploying code.
- Data Processing: Advanced tools use a Python Processing Engine to transform data in flight and enforce governance layers before storage.
- Context Enrichment : Automatically appends environment metadata (node, cluster) to every log entry.
The Power of Open Source Log Aggregation for Enterprise Scales
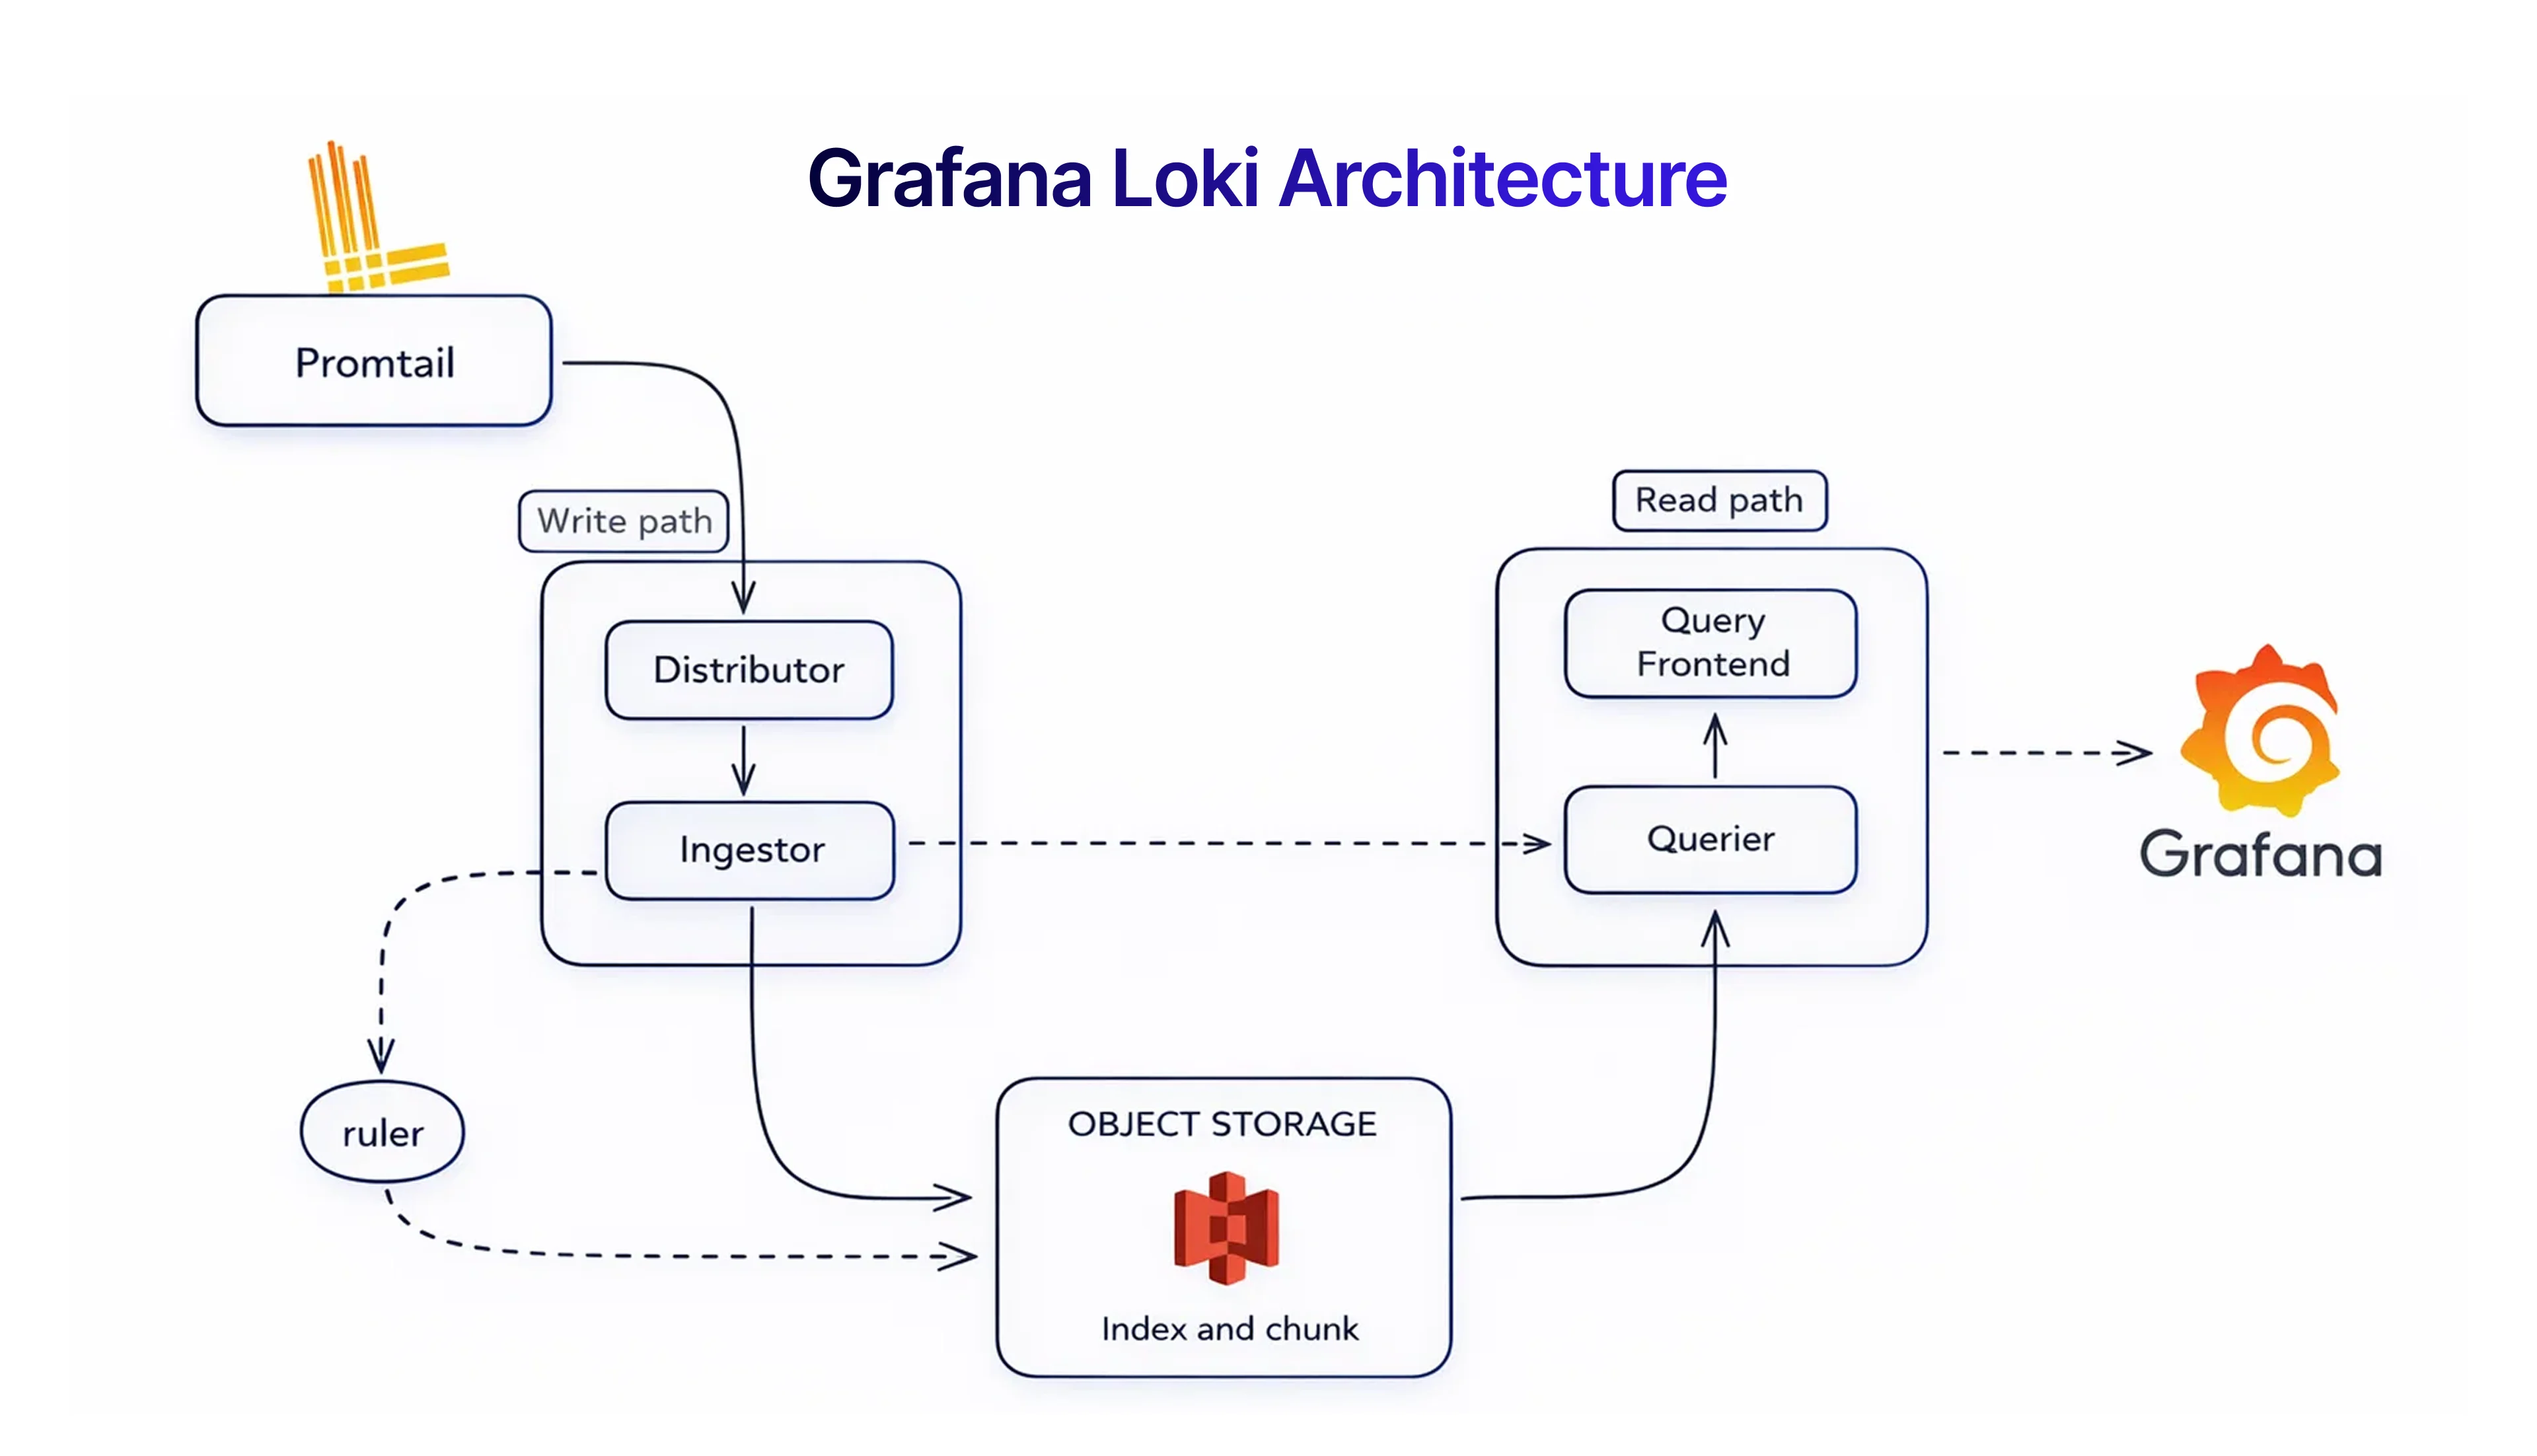
Many enterprises are moving away from proprietary "black box" logging tools toward log aggregation open source stacks. These offer transparency, flexibility, and significant cost savings. Leading choices in 2026 include
- Grafana Loki : Reduces costs by indexing only metadata (labels) rather than full log content.
- ELK/OpenSearch : The gold standard for deep, full-text analytics using Fluent Bit and Logstash.
- InfluxDB 3: A high-performance time series database built for cardinality. It supports schedule triggers and streamlined workflows (like influxdb3 create database) to handle massive loads.
- Vector : A high-performance router used to redact PII and enforce governance layers before data hits storage.
Correlating Logs, Metrics, and Traces for Root Cause Analysis
Observability helps detect silent failures and accelerate root cause analysis beyond what traditional monitoring tools can provide. While metrics indicate that something is wrong, distributed tracing and logs reveal where an API call failed and why.
When telemetry is unified inside a time series database like InfluxDB 3, signals connect through correlation IDs, turning raw data into actionable insights and automated Slack alerts. This reduces MTTR dramatically and eliminates blind spots across services.
By treating telemetry as a first-class architectural component, teams improve service reliability, strengthen agent observability and infrastructure observability, and prevent silent failures from escalating into outages or compliance risks.
Best Practices to Detect Silent Failures in Microservices
To detect silent failures in microservices effectively
- Implement distributed tracing across all services
- Use statistical and ML-based anomaly detection models
- Correlate logs, metrics, and traces using a shared correlation ID
- Apply tail-based sampling to capture high-latency events
- Validate production behavior through structured performance testing
- Monitor latency percentiles (P95, P99) instead of averages
Conclusion: Shifting from Reactive to Proactive Observability
Moving from traditional monitoring to advanced observability is a shift from reactive dashboards to real-time anomaly detection and distributed tracing.
As architectures expand to include serverless functions, Internet of Things (IoT) integrations, and complex automation across the enterprise operating stack, proactive observability becomes essential.
Silence is not a sign of health in a microservices environment rather, it is frequently a cover for complexity. Teams can ultimately uncover the "grey failures" that reduce revenue and undermine user trust by constructing a strong telemetry pipeline and connecting logs, metrics, and traces. Proactive observability isn’t just a technical upgrade. It’s what keeps complex distributed systems reliable as they scale.
How BuildNexTech and Frugal Testing Can Help
Putting these cutting-edge methods into practice is a big task that calls for a combination of architectural knowledge and exacting quality control. This is where specialized partners become invaluable.
- BuildNexTech : Specializing in modern cloud infrastructure and microservices orchestration, BuildNexTech helps organizations design and deploy scalable distributed tracing systems and telemetry pipelines. They ensure that your observability stack is not just a collection of tools, but a cohesive strategy integrated into your enterprise operating stack.
- Frugal Testing : High-level observability is useless if the underlying system isn't battle-tested through structured reliability and load testing practices. Frugal Testing provides deep expertise in performance and reliability testing, helping you simulate "silent failure" scenarios in staging environments. They assist you in validating your ML anomaly detection models and making sure your alerting logic is adjusted to detect actual problems while reducing "alert fatigue" by employing sophisticated testing methodologies.
These partners work together to offer the comprehensive support required to transition your company from reactive firefighting to proactive, high-definition visibility.
People also ask for (FAQ’S)
Q1.Why are health checks green while the service is failing?
Ans: Liveness probes only verify a process is running, silent failures occur when the service is alive but logically broken (e.g., corrupted data or JSON Schema errors).
Q2.Why do metrics show spikes but traces look normal?
Ans: You are likely using head-based sampling. Switch to tail-based sampling to capture outliers and full API calls.
Q3.How do we handle different log formats?
Ans: Use structured logging and tools like Vector to normalize schemas before ingestion, ensuring Actionable insights.
Q4.Does Anomaly Detection replace static alerts?
Ans: No. Static alerts handle "known" thresholds, anomaly detection catches "unknown" shifts and model drift.
Q5.Is Distributed Tracing Too Expensive?
Ans: Not if you use strategic sampling and ensure context propagation is efficient across every service, maintaining cost control.


.webp)